Stock Analysis · Global Net Lease Inc (GNL)
Overview
Global Net Lease Inc. is a real estate investment trust, or REIT, that owns income-producing commercial properties and leases them to tenants under contracts that are typically designed to produce predictable rent. Its portfolio is built around net leases, a structure in which tenants usually pay not only rent but also most property-level costs such as taxes, insurance, and maintenance. That model can make cash flows more stable than in many other types of real estate.
The company operates as a diversified landlord with assets across the United States and Europe. Based on recent company disclosures, its portfolio is spread across industrial and distribution facilities, single-tenant retail properties, and office buildings, with industrial and retail now representing the larger strategic focus after portfolio repositioning. Revenue mainly comes from contractual rental income, while smaller contributions can come from reimbursement income, fee-related items, and gains or losses linked to asset sales or accounting adjustments.
At a high level, the main revenue drivers are:
- Rental income from industrial and distribution properties — a major share of rent, supported by logistics, warehouse, and operating facilities leased to corporate tenants.
- Rental income from retail properties — another large source, mainly from single-tenant commercial sites with long lease terms.
- Rental income from office properties — still meaningful, but less strategically favored because office demand is structurally weaker than industrial and necessity-based retail.
- Other property-related income — generally a small portion, including reimbursements and miscellaneous lease-related amounts.
For long-term readers, the most important point is that this is not a high-growth operating business in the usual sense. It is primarily a cash-flow vehicle built on rent collection, property financing, and capital recycling. That makes tenant quality, lease duration, occupancy, debt costs, and asset sales just as important as headline revenue.
The operating flow over the last few years shows a mixed pattern: revenue expanded sharply in 2024, operating income recovered, but interest expense remained very heavy and net income stayed negative. That combination highlights the basic tension in the current investment case: the underlying properties still produce substantial rent, but financing costs and balance-sheet pressure continue to absorb a large share of that cash generation.
The broad trend suggests that property-level earnings are more resilient than bottom-line profit. Gross profit and operating income improved after the difficult 2023 period, but interest expense has remained unusually large, which has limited the benefit to shareholders.
Key Figures
| Metric | Value | Sector ⓘ |
|---|---|---|
| Date | Oct 17, 2026 | |
| Context | ||
| Sector | Real Estate | |
| Industry | REIT - Diversified | |
| Market Cap ⓘ | $1.74B | |
| Beta ⓘ | 1.02 | |
Value (Cheapness) | ||
| P/E Ratio ⓘ | N/A | 17.38 |
| P/B Ratio ⓘ | 1.04 | 0.85 |
| FCF Yield ⓘ | 11.57% | 7.38% |
| Dividend Yield ⓘ | 9.91% | 4.85% |
| EBIT / EV ⓘ | 3.99% | 3.78% |
| PEG ⓘ | N/A | |
Growth (Business expansion) | ||
| Revenue Growth ⓘ | -10.00% | 5.30% |
| RPS Growth (5Y CAGR) ⓘ | -13.48% | 6.02% |
| EPS Growth (5Y CAGR) ⓘ | -19.27% | -11.37% |
| BVPS Growth (5Y CAGR) ⓘ | -17.94% | 0.45% |
| Margin Growth (5Y Trend) ⓘ | -14.48% | -0.22% |
| FCF Growth (5Y CAGR) ⓘ | 0.65% | 5.40% |
| DPS Growth (5Y CAGR) ⓘ | -12.37% | 5.02% |
Quality (Business durability) | ||
| ROIC (Latest) ⓘ | 2.65% | 5.69% |
| ROE (Latest) ⓘ | -2.26% | 7.56% |
| ROA (Latest) ⓘ | -0.31% | 2.85% |
| ROIC (5Y Median) ⓘ | 1.45% | 4.22% |
| ROE (5Y Median) ⓘ | -7.30% | 6.03% |
| ROA (5Y Median) ⓘ | -1.75% | 2.44% |
| Net Debt / EBIT (Latest) ⓘ | 13.33 | 7.59 |
| Net Debt / EBIT (5Y Median) ⓘ | 21.34 | 8.40 |
| Net Debt / EBITDA (Latest) ⓘ | 6.55 | 5.27 |
| Net Debt / Assets ⓘ | 56.26% | 37.76% |
| EBITDA / Interest ⓘ | 2.11 | 4.10 |
| Operating Margin (Latest) ⓘ | 37.34% | 35.29% |
| Operating Margin (5Y Median) ⓘ | 24.82% | 37.31% |
| Debt to Equity (Latest) ⓘ | 162.72% | 88.87% |
| Profit Margin (Latest) ⓘ | -2.94% | 19.61% |
| Free Cash Flow (Latest) ⓘ | $201.18M | |
Momentum (Price trend) | ||
| 3Y Return ⓘ | +25.16% | +30.75% |
| 12M Return (excl. last month) ⓘ | +20.32% | +4.36% |
| 6M Return ⓘ | -17.97% | -2.52% |
| Price vs. 200-Day MA ⓘ | -14.92% | -2.34% |
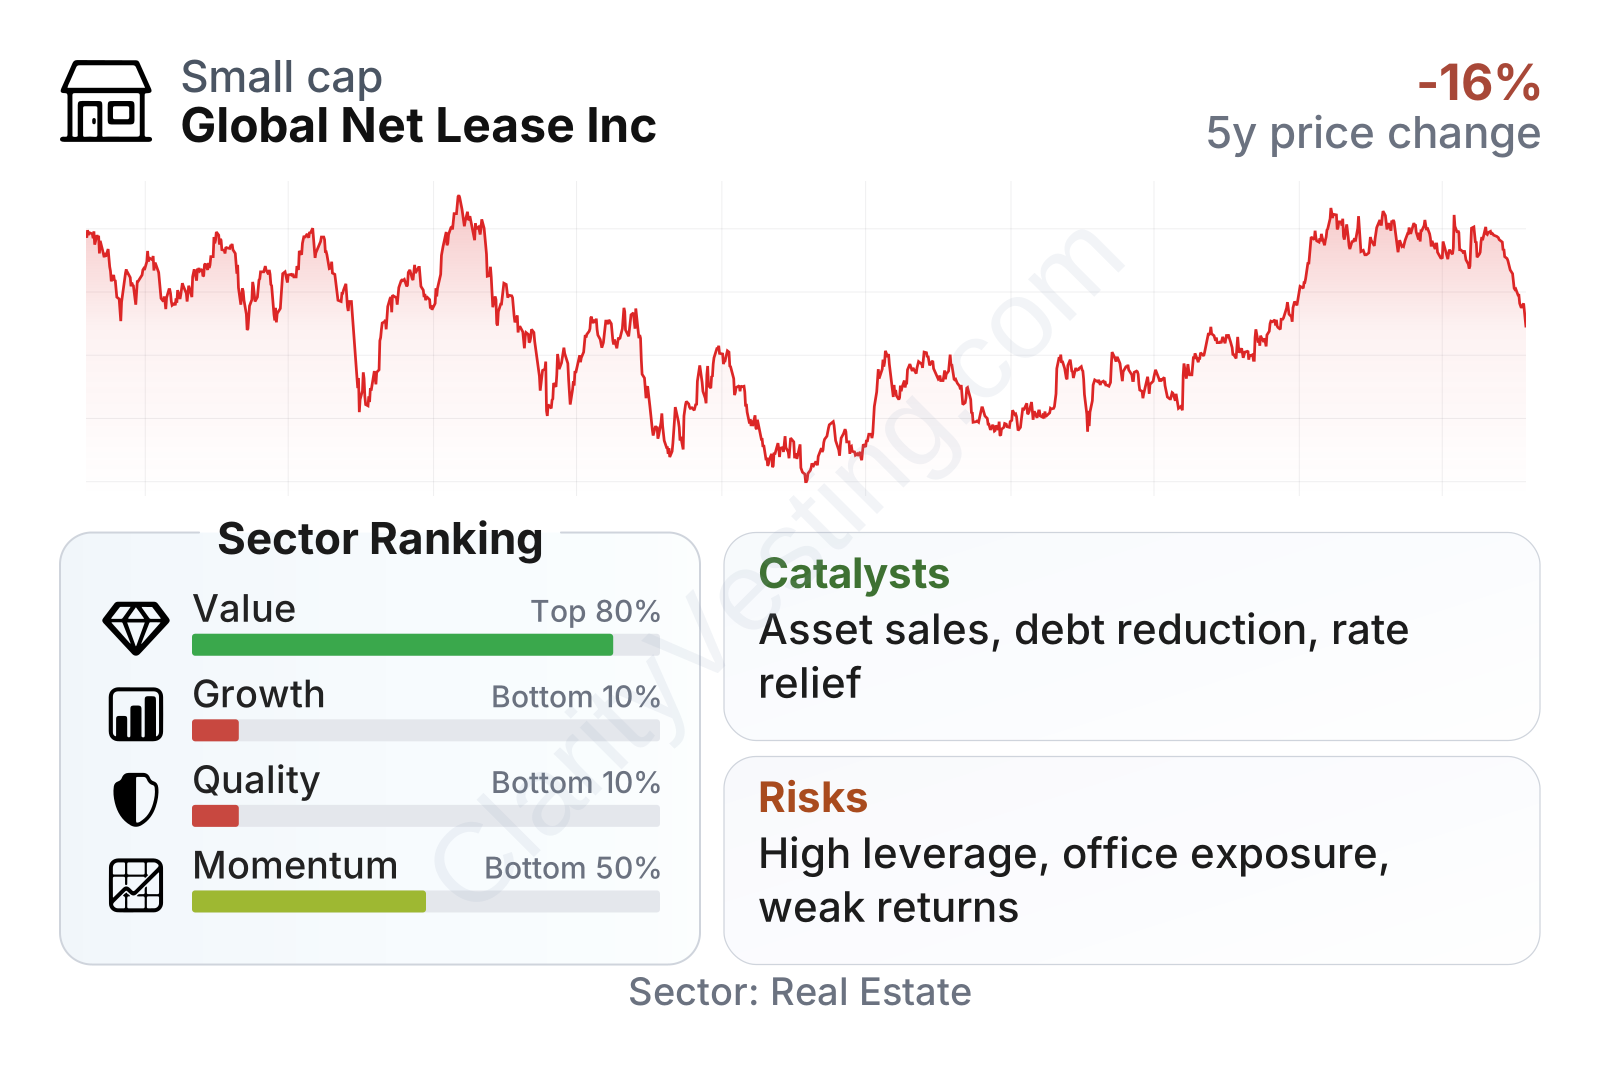
Global Net Lease is a mid-sized public REIT with market value around the low-single-digit billions of dollars and a share price history that has been volatile over the last several years. The stock recovered strongly over the past year before easing somewhat in recent months. In the factor summary, valuation looks mixed rather than clearly cheap, quality and growth rank poorly versus the broader real estate sector, and momentum has been somewhat better than the company’s long-term fundamentals.
The table also points to an important contradiction. The shares offer a free cash flow yield above the sector median and a dividend yield well above the sector median, but those apparently attractive income metrics sit next to weak growth, low returns on capital, negative profitability, and leverage that remains elevated. In other words, the headline yield is easy to notice, while the balance-sheet and earnings profile require more caution.
Growth
Global Net Lease operates in a sector that can still produce long-term demand, but the growth outlook depends heavily on which property types it emphasizes. Industrial real estate remains the most favorable area because logistics networks, inventory management, and distribution needs continue to support leasing demand. Retail can also be durable when properties are tied to essential uses or strong tenant credit. Office is the least attractive part of the mix because remote and hybrid work continue to pressure demand and property values in many markets.
The company’s current strategy makes sense only if viewed as a repositioning effort rather than a straightforward expansion plan. Management has been working to simplify the portfolio, reduce exposure to weaker categories, and improve the capital structure over time. That approach is logical for a net-lease landlord facing higher interest rates: selling non-core assets, emphasizing industrial and retail, extending leases, and reducing debt can improve the durability of future cash flow even if near-term growth stays limited.
Revenue per share has moved in the wrong direction over the last five years, which shows that growth has not translated into better economics for each share outstanding. That is a key issue for long-term analysis, because REITs can grow total rent while still delivering weaker per-share results if acquisitions, asset sales, financing costs, or equity issuance work against shareholders.
The dividend trend tells a similar story. The payout per share has been reduced materially over time, even though the current yield remains high because the stock price has been depressed for much of the period. For a long-term income-focused reader, that is an important distinction: a high yield can reflect market skepticism just as much as business strength.
A realistic catalyst would be continued progress on asset sales, debt reduction, and refinancing. If the company can steadily lower interest burden and increase exposure to industrial and necessity-oriented assets, the earnings profile could become more stable. Another potential support is that long lease contracts can create visibility once financing pressure eases. More broadly, any environment with lower borrowing costs would likely help net-lease REITs, and GNL is especially sensitive because interest expense has been such a large drag on results.
Recent company communications have also centered on portfolio management, dispositions, and balance-sheet actions rather than aggressive external growth. That is significant: the near-term opportunity is less about rapid expansion and more about repairing the economics of the existing platform.
Risks
This article is for informational purposes only and does not constitute financial advice. Some content is AI-generated. See Disclaimer


