Stock Analysis · Genco Shipping & Trading Ltd (GNK)
Overview
Genco Shipping & Trading Ltd is a dry bulk shipping company. It owns and operates vessels that transport large-volume raw materials used across the global economy, such as iron ore, coal, grain, steel products, bauxite, and other minor bulk cargoes. In simple terms, Genco makes money by renting out ships to move commodities between exporting and importing countries.
The company’s fleet is spread across major dry bulk vessel classes, with a strong presence in Capesize ships, which usually carry iron ore and coal on long-haul routes, and Ultramax/Supramax ships, which tend to serve more diversified cargo markets such as grain, fertilizers, steel products, petcoke, and bauxite. This mix matters because larger ships can benefit strongly when iron ore and coal demand is firm, while the mid-sized fleet can provide broader cargo exposure.
Revenue mainly comes from voyage and time charter earnings generated by its fleet. Based on the company’s fleet mix and disclosures about vessel categories, the revenue base is best understood as follows:
- Capesize vessels: approximately 45% to 55% of revenue in a typical year, depending on charter rates and vessel availability. These ships are mostly tied to iron ore and coal trades and tend to have the highest sensitivity to swings in global commodity demand.
- Ultramax/Supramax vessels: approximately 45% to 55% of revenue. These ships usually carry a wider range of cargoes including grains, steel products, fertilizers, salt, cement clinker, bauxite, and other minor bulks.
- Other operating revenue: a small share, generally linked to freight-related services, charter adjustments, and voyage-related items rather than a separate business line.
One important point for long-term readers is that Genco is not a manufacturer or commodity producer. It is a transporter. That means its results depend less on discovering new products and more on vessel supply, global trade volumes, charter rates, fuel and voyage costs, and disciplined balance-sheet management.
The business flow over the last several years shows how cyclical this model is. Revenue stayed above $500 million in 2021 and 2022, dropped sharply in 2023, partially recovered in 2024, and weakened again in 2025. Profitability followed the same pattern, with strong earnings during favorable shipping markets and much thinner results when rates softened. That volatility is central to understanding the company.
The operating profile shows that shipping costs absorb most of revenue, while overhead has historically remained relatively modest. The bigger swing factor has been charter-market strength rather than administrative spending. In other words, when freight rates are healthy, earnings can expand quickly; when rates weaken, profits compress just as fast.
Key Figures
| Metric | Value | Sector ⓘ |
|---|---|---|
| Date | Oct 17, 2026 | |
| Context | ||
| Sector | Industrials | |
| Industry | Marine Shipping | |
| Market Cap ⓘ | $1.18B | |
| Beta ⓘ | 0.93 | |
Value (Cheapness) | ||
| P/E Ratio ⓘ | 29.46 | 22.10 |
| P/B Ratio ⓘ | 1.36 | 1.97 |
| FCF Yield ⓘ | -13.17% | 6.38% |
| Dividend Yield ⓘ | 6.60% | 1.94% |
| EBIT / EV ⓘ | 4.07% | 4.79% |
| PEG ⓘ | -1.77 | |
Growth (Business expansion) | ||
| Revenue Growth ⓘ | 68.50% | 9.30% |
| RPS Growth (5Y CAGR) ⓘ | -11.48% | 7.81% |
| EPS Growth (5Y CAGR) ⓘ | -31.17% | -13.06% |
| BVPS Growth (5Y CAGR) ⓘ | -1.04% | 6.14% |
| Margin Growth (5Y Trend) ⓘ | -33.82% | 0.88% |
| FCF Growth (5Y CAGR) ⓘ | N/A | 11.01% |
| DPS Growth (5Y CAGR) ⓘ | 24.37% | 9.48% |
Quality (Business durability) | ||
| ROIC (Latest) ⓘ | 4.37% | 10.84% |
| ROA (Latest) ⓘ | 3.40% | 5.41% |
| ROIC (5Y Median) ⓘ | 6.63% | 9.38% |
| ROA (5Y Median) ⓘ | 6.95% | 4.95% |
| Net Debt / EBIT (Latest) ⓘ | 4.41 | 2.08 |
| Net Debt / EBIT (5Y Median) ⓘ | 0.67 | 2.27 |
| Net Debt / EBITDA (Latest) ⓘ | 1.78 | 1.39 |
| Net Debt / Assets ⓘ | 19.95% | 19.28% |
| EBITDA / Interest ⓘ | 8.13 | 9.58 |
| Operating Margin (Latest) ⓘ | 12.96% | 10.50% |
| Operating Margin (5Y Median) ⓘ | 21.23% | 10.29% |
| Debt to Equity (Latest) ⓘ | 36.60% | 65.48% |
| Profit Margin (Latest) ⓘ | 9.15% | 6.67% |
| Free Cash Flow (Latest) ⓘ | -$155.57M | |
Momentum (Price trend) | ||
| 3Y Return ⓘ | +129.42% | +61.68% |
| 12M Return (excl. last month) ⓘ | +67.69% | +12.58% |
| 6M Return ⓘ | +20.80% | 0.00% |
| Price vs. 200-Day MA ⓘ | +18.23% | +0.02% |
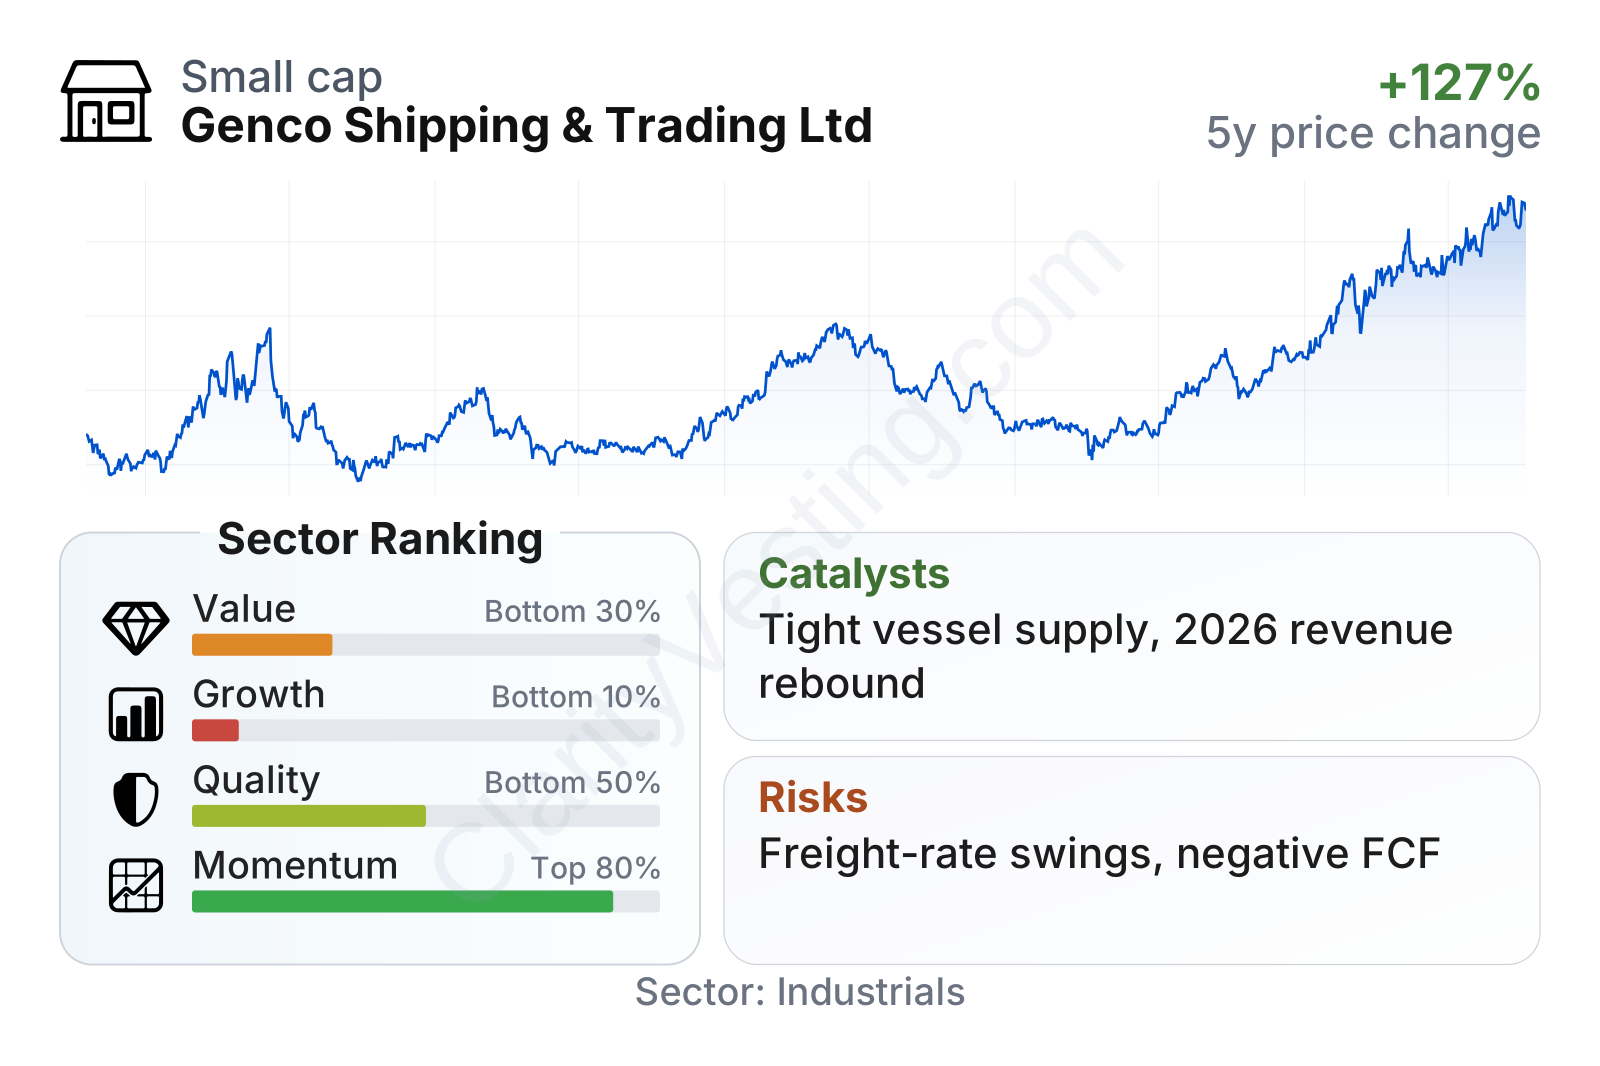
Genco sits in the mid-cap range and its share-price volatility, measured by beta, is close to the broader market on paper, although shipping stocks can still move sharply with freight conditions. The factor picture is mixed. Value metrics do not look especially cheap at the moment, with the earnings multiple above the sector median, while growth rankings remain weak over a five-year view because the shipping cycle has produced uneven results. Quality is more balanced: leverage is lower than the sector median and current profit margin is above the median, but returns on capital are not standout levels. Momentum is clearly stronger, reflecting a sharp stock-price recovery over the last year and over a three-year period.
Growth
Dry bulk shipping is not a classic structural high-growth sector. It is a global trade infrastructure business tied to industrial production, steelmaking, energy flows, and agricultural exports. Long-term demand can still grow, but usually in a gradual and uneven way. What makes the sector attractive at times is not steady expansion, but periods when vessel supply stays tight while cargo demand improves. In those phases, freight rates can rise quickly and shipping companies can generate strong cash earnings.
Genco’s strategy is sensible for this type of industry. The company emphasizes a diversified fleet, a relatively conservative balance sheet compared with many shipping peers, and a capital allocation framework that has historically included debt reduction and shareholder distributions. That approach does not eliminate cyclicality, but it can improve resilience when freight markets weaken and leave room to benefit when rates rebound.
Recent revenue growth has improved sharply after a weak 2025, with year-over-year growth moving back into strongly positive territory in 2026. That rebound is notable because it suggests the company is emerging from a softer part of the freight cycle. Still, the longer five-year growth record remains weak, which shows that one strong rebound does not erase the underlying volatility of the business.
Free cash flow has been much less stable than revenue. The company generated healthy cash in earlier periods, but trailing twelve-month free cash flow has turned meaningfully negative. For a shipping company, this can happen when vessel acquisitions, drydocking, upgrades, or other capital needs rise faster than operating cash generation. It does not automatically signal deterioration, but it does make the current phase less straightforward than the recent revenue rebound alone might suggest.
A key long-term catalyst is the supply side of the dry bulk market. New vessel ordering across the industry has remained relatively disciplined compared with past cycles, and environmental regulations can slow effective fleet growth by pushing ships to operate at lower speeds or by increasing the cost of replacing older vessels. If commodity demand remains healthy while fleet growth stays contained, charter rates could remain supportive.
Another useful catalyst is Genco’s exposure to both major bulk and minor bulk trades. If iron ore demand improves, the Capesize fleet can benefit. If agricultural exports, infrastructure materials, or diversified regional trade flows strengthen, the Ultramax/Supramax fleet can help offset concentration risk. That gives the company more than one path to participate in stronger freight markets.
Risks
This article is for informational purposes only and does not constitute financial advice. Some content is AI-generated. See Disclaimer


