Stock Analysis · Goodman Group (GMGSF)
Overview
Goodman Group is an Australian industrial property company focused on logistics and digital infrastructure. In simple terms, it develops, owns, and manages the kinds of buildings that help move goods and store data: warehouses, distribution centers, business parks, and increasingly data center projects. Its customers typically include e-commerce companies, logistics operators, manufacturers, retailers, and technology-related tenants.
The group operates through a business model that combines recurring property income with development profits and management earnings from investment partnerships. That mix matters because it gives Goodman exposure to both steady cash generation and growth from new projects. Its platform is global, with major activity in Australia, Asia, Europe, the United Kingdom, New Zealand, and North America.
Based on Goodman’s latest annual reporting, revenue and earnings are mainly supported by the following activities:
- Property investment income: rent and related income from warehouses, logistics facilities, business parks, and other industrial assets held on the balance sheet. This is a major recurring source of earnings.
- Development income: profits from developing and sometimes selling industrial and logistics properties, including large pre-leased facilities and data center-related projects. This tends to be more cyclical than rental income but can lift results meaningfully in strong years.
- Management income: fees earned from managing listed and unlisted property partnerships, including asset management, performance-related fees, and other investment management services.
Goodman does not report its business in exactly the same way as a simple retailer or manufacturer, so precise percentages can vary with property valuations, timing of developments, and partnership activity. Broadly, the company’s earnings mix is anchored by rental income and development activity, with funds management adding an additional fee stream that benefits from the scale of its investment platform.
The recent operating profile points to a strong rebound after a weaker 2024 period. Revenue moved from roughly $1.9 billion to about $2.7 billion by fiscal 2026, while operating income and net income also recovered sharply. The business remains unusually profitable for the real estate sector, reflecting both development gains and the value of premium logistics assets in land-constrained urban markets.
The multi-year pattern shows that Goodman’s results can swing from year to year because development completions, asset valuations, and partnership activity do not arrive evenly. Even so, the latest year shows a clear improvement in scale and profitability, with revenue at a new high and interest expense notably lower than in the prior few years.
Key Figures
| Metric | Value | Sector ⓘ |
|---|---|---|
| Date | Oct 03, 2026 | |
| Context | ||
| Sector | Real Estate | |
| Industry | REIT - Diversified | |
| Market Cap ⓘ | $36.18B | |
| Beta ⓘ | 1.03 | |
Value (Cheapness) | ||
| P/E Ratio ⓘ | 18.94 | 17.35 |
| P/B Ratio ⓘ | 1.02 | 0.86 |
| FCF Yield ⓘ | 7.83% | 7.47% |
| Dividend Yield ⓘ | 1.70% | 4.75% |
| EBIT / EV ⓘ | N/A | 3.81% |
| PEG ⓘ | N/A | |
Growth (Business expansion) | ||
| Revenue Growth ⓘ | 65.80% | 5.30% |
| RPS Growth (5Y CAGR) ⓘ | 14.37% | 5.96% |
| EPS Growth (5Y CAGR) ⓘ | 23.87% | -11.41% |
| BVPS Growth (5Y CAGR) ⓘ | 18.96% | 0.41% |
| Margin Growth (5Y Trend) ⓘ | -81.26% | 0.53% |
| FCF Growth (5Y CAGR) ⓘ | N/A | 5.40% |
| DPS Growth (5Y CAGR) ⓘ | 9.02% | 5.02% |
Quality (Business durability) | ||
| ROIC (Latest) ⓘ | N/A | 5.77% |
| ROE (Latest) ⓘ | 20.27% | 7.64% |
| ROA (Latest) ⓘ | 14.58% | 2.85% |
| ROIC (5Y Median) ⓘ | 9.35% | 4.20% |
| ROE (5Y Median) ⓘ | 9.06% | 6.03% |
| ROA (5Y Median) ⓘ | 6.86% | 2.45% |
| Net Debt / EBIT (Latest) ⓘ | N/A | 7.57 |
| Net Debt / EBIT (5Y Median) ⓘ | 0.61 | 8.41 |
| Net Debt / EBITDA (Latest) ⓘ | 0.39 | 5.12 |
| Net Debt / Assets ⓘ | 5.98% | 37.84% |
| EBITDA / Interest ⓘ | 15.06 | 4.11 |
| Operating Margin (Latest) ⓘ | N/A | 35.40% |
| Operating Margin (5Y Median) ⓘ | 103.05% | 36.59% |
| Debt to Equity (Latest) ⓘ | 24.41% | 89.06% |
| Profit Margin (Latest) ⓘ | 68.44% | 19.99% |
| Free Cash Flow (Latest) ⓘ | $2.83B | |
Momentum (Price trend) | ||
| 3Y Return ⓘ | +32.51% | +30.60% |
| 12M Return (excl. last month) ⓘ | -17.22% | +7.55% |
| 6M Return ⓘ | +7.79% | +0.69% |
| Price vs. 200-Day MA ⓘ | -13.89% | -2.30% |
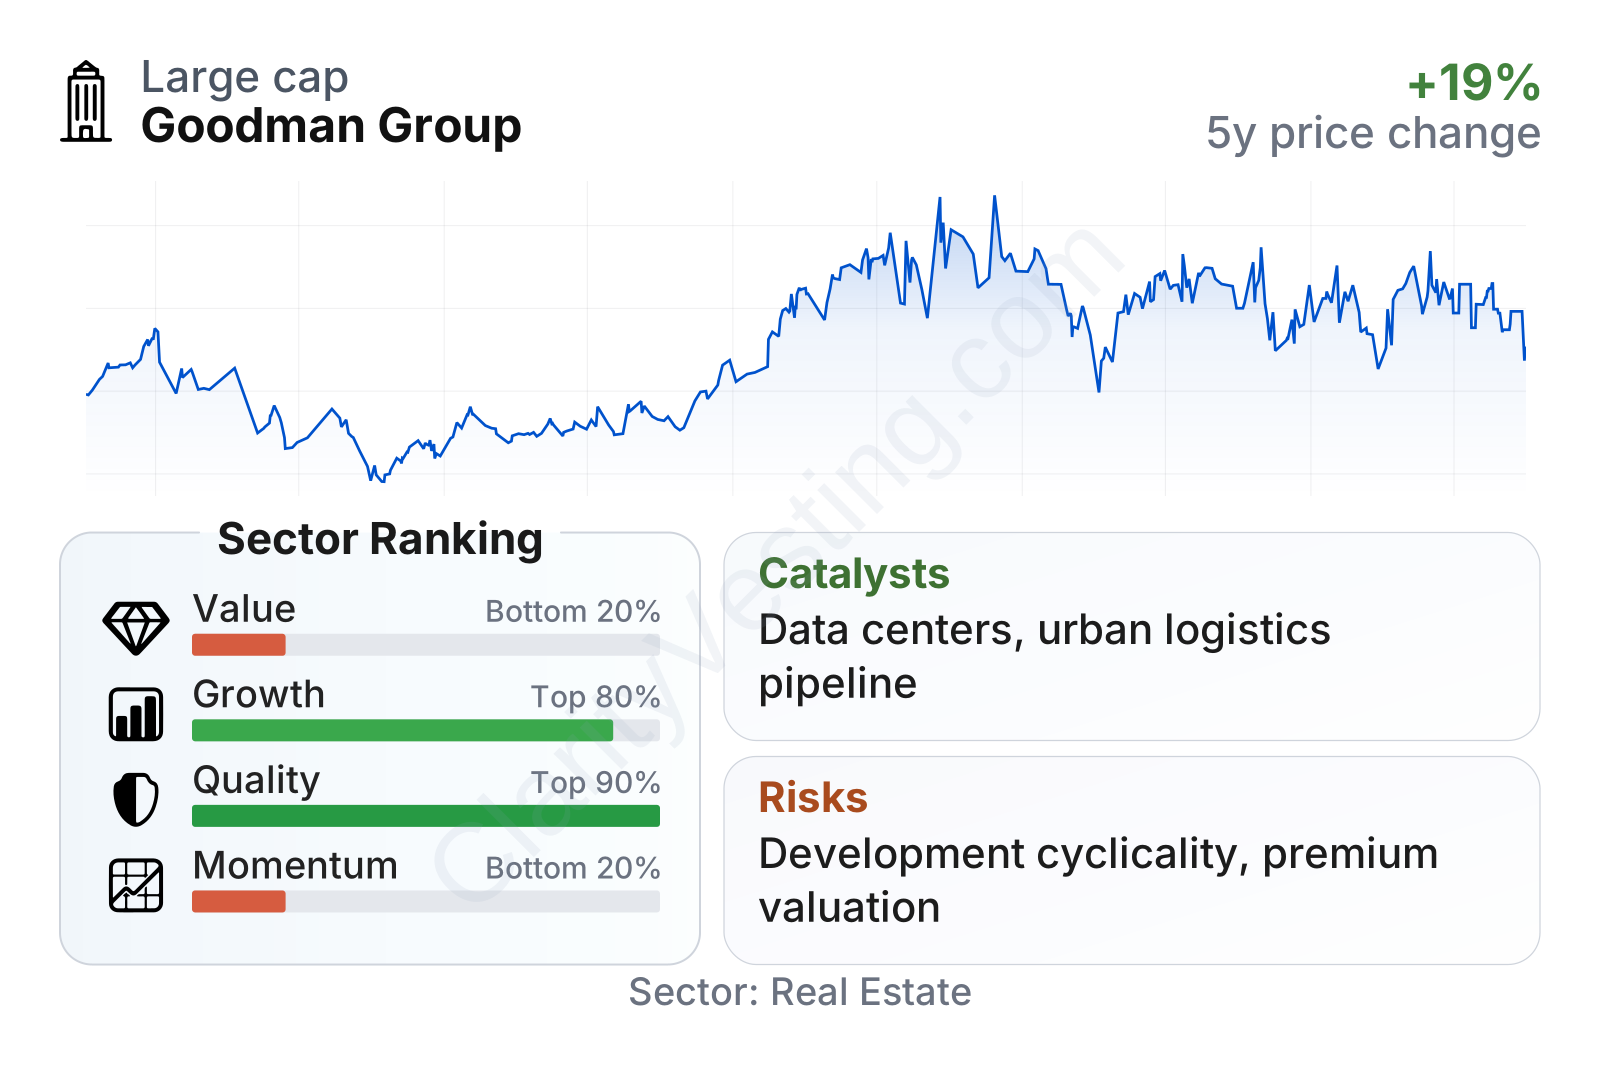
Goodman is a large real estate company with market value above $40 billion and share-price volatility close to the broader market. The overall profile is unusual for a REIT-like business: valuation measures are weaker than much of the sector, but growth and quality metrics are much stronger. Revenue growth over the last year was around 66%, far above the sector median near 5%, while five-year growth in revenue per share, earnings per share, book value per share, and dividends has also been well ahead of many peers. Profitability and balance-sheet quality stand out even more, with return on equity around 20%, return on assets around 15%, low debt relative to assets, and strong interest coverage. The weaker area is recent market momentum, as the stock has lagged the sector over the last 12 months despite a stronger long-term record.
Growth
Goodman operates in one of the more attractive parts of real estate: modern logistics facilities and adjacent digital infrastructure. Demand in this area has been supported for years by e-commerce, supply-chain redesign, faster delivery expectations, and the need for well-located warehouses near large population centers. More recently, data centers have added another growth lane, especially where power access and land availability create barriers to entry.
Its strategy is built around exactly those themes. Goodman focuses on scarce urban land, long-term customer relationships, and a development pipeline that can be recycled through managed partnerships. That model gives the company multiple ways to expand: it can earn rent from completed assets, development profit from new projects, and management fees from third-party capital invested alongside it. This is more flexible than relying only on rent collection.
The revenue-per-share trend reflects that strategy well. After a relatively flat period, the latest year shows a sharp acceleration, suggesting that recent project completions and business activity translated into much stronger economic output on a per-share basis rather than growth coming only from balance-sheet expansion.
A major catalyst is the company’s exposure to data centers and power-connected industrial land. In many gateway cities, suitable sites are limited, permitting can be slow, and electricity access is a real constraint. A developer-owner with an existing land bank and customer network can be in a favorable position when demand rises. Goodman has been highlighting this opportunity in its corporate communications, alongside continued demand for high-quality logistics space.
The dividend trend is also constructive. The payout was broadly stable for several years and then stepped up materially in the latest period. That does not make Goodman a high-yield real estate name today, but it does suggest that cash generation and earnings strength have improved enough to support a higher distribution.
Another growth support is the company’s global capital platform. By managing investment partnerships, Goodman can pursue larger projects without funding everything directly on its own balance sheet. That can improve returns, broaden its customer reach, and help it keep developing even when parts of the property market are slower. For a long-term view, this combination of logistics, urban infill development, and digital infrastructure is one of the clearest positives in the case.
Risks
This article is for informational purposes only and does not constitute financial advice. Some content is AI-generated. See Disclaimer