Stock Analysis · Glencore PLC (GLNCY)
Overview
Glencore is a large global natural resources company built around two connected activities: producing commodities and marketing them. On one side, it owns mining and industrial assets that produce metals, minerals, and energy products. On the other, it runs one of the world’s biggest commodity trading and logistics networks, moving raw materials from producers to customers across regions. This combination makes Glencore different from a pure mining company because a meaningful part of its business comes from trading, blending, shipping, storage, and risk management rather than only extracting materials from the ground.
Its operations are centered on coal, copper, zinc, nickel, ferroalloys, recycling, and commodity marketing. The company also has exposure to oil trading and agricultural-related activities through its marketing operations and selected investments. For long-term analysis, the key point is that Glencore is tied both to industrial demand for metals and to global commodity market volatility, which can sometimes help its marketing arm when price dislocations and regional shortages increase trading opportunities.
Based on Glencore’s recent annual reporting structure, revenue is dominated by the Marketing segment, while Industrial Activities contribute a smaller share of total revenue but often remain highly important for profit generation. Approximate revenue mix is as follows:
- Marketing: about 75% to 85% of revenue. This includes physical trading, logistics, blending, storage, freight, and optimization across metals, minerals, energy, and oil products.
- Industrial Activities: about 15% to 25% of revenue. This includes production from mining and processing assets such as coal, copper, zinc, nickel, ferroalloys, and recycling operations.
Within industrial production, earnings exposure is usually concentrated in a few large commodity groups rather than evenly spread. Coal has recently been a major cash generator, while copper, zinc, and nickel are central to the company’s longer-term positioning because they are used in electrification, grids, batteries, and industrial manufacturing.
The business model is unusually broad for the sector: Glencore is not simply selling ore production volume, but also monetizing market complexity. That can support resilience in some weak commodity periods, although it also makes the company harder to analyze than a more straightforward miner.
The recent financial flow shows a business with enormous revenue but thin margins. Revenue recovered after the 2023 decline and continued rising into 2025, yet profit conversion weakened sharply from the 2022 peak. Rising interest expense and a much narrower operating margin are important features of the current profile.
Key Figures
| Metric | Value | Sector ⓘ |
|---|---|---|
| Date | Oct 17, 2026 | |
| Context | ||
| Sector | Basic Materials | |
| Industry | Other Industrial Metals & Mining | |
| Market Cap ⓘ | $90.91B | |
| Beta ⓘ | 0.57 | |
Value (Cheapness) | ||
| P/E Ratio ⓘ | 17.23 | 16.90 |
| P/B Ratio ⓘ | 1.94 | 1.65 |
| FCF Yield ⓘ | 0.35% | 5.76% |
| Dividend Yield ⓘ | 2.19% | 2.13% |
| EBIT / EV ⓘ | 6.43% | 6.30% |
| PEG ⓘ | 0.21 | |
Growth (Business expansion) | ||
| Revenue Growth ⓘ | 48.60% | 11.10% |
| RPS Growth (5Y CAGR) ⓘ | 7.66% | 4.49% |
| EPS Growth (5Y CAGR) ⓘ | N/A | -13.47% |
| BVPS Growth (5Y CAGR) ⓘ | 5.13% | 5.51% |
| Margin Growth (5Y Trend) ⓘ | -1.85% | -1.54% |
| FCF Growth (5Y CAGR) ⓘ | -47.81% | 0.37% |
| DPS Growth (5Y CAGR) ⓘ | -11.04% | 6.08% |
Quality (Business durability) | ||
| ROIC (Latest) ⓘ | 8.86% | 9.26% |
| ROA (Latest) ⓘ | 2.37% | 4.91% |
| ROIC (5Y Median) ⓘ | 4.91% | 7.70% |
| ROA (5Y Median) ⓘ | 3.34% | 3.86% |
| Net Debt / EBIT (Latest) ⓘ | 5.06 | 1.40 |
| Net Debt / EBIT (5Y Median) ⓘ | 5.23 | 1.70 |
| Net Debt / EBITDA (Latest) ⓘ | 1.78 | 0.95 |
| Net Debt / Assets ⓘ | 26.78% | 13.69% |
| EBITDA / Interest ⓘ | 4.48 | 12.34 |
| Operating Margin (Latest) ⓘ | 1.53% | 13.20% |
| Operating Margin (5Y Median) ⓘ | 3.00% | 11.80% |
| Debt to Equity (Latest) ⓘ | 108.47% | 40.56% |
| Profit Margin (Latest) ⓘ | 1.78% | 6.43% |
| Free Cash Flow (Latest) ⓘ | $320.41M | |
Momentum (Price trend) | ||
| 3Y Return ⓘ | +47.86% | +68.89% |
| 12M Return (excl. last month) ⓘ | +100.87% | +30.21% |
| 6M Return ⓘ | +1.79% | -4.16% |
| Price vs. 200-Day MA ⓘ | +6.16% | -1.27% |
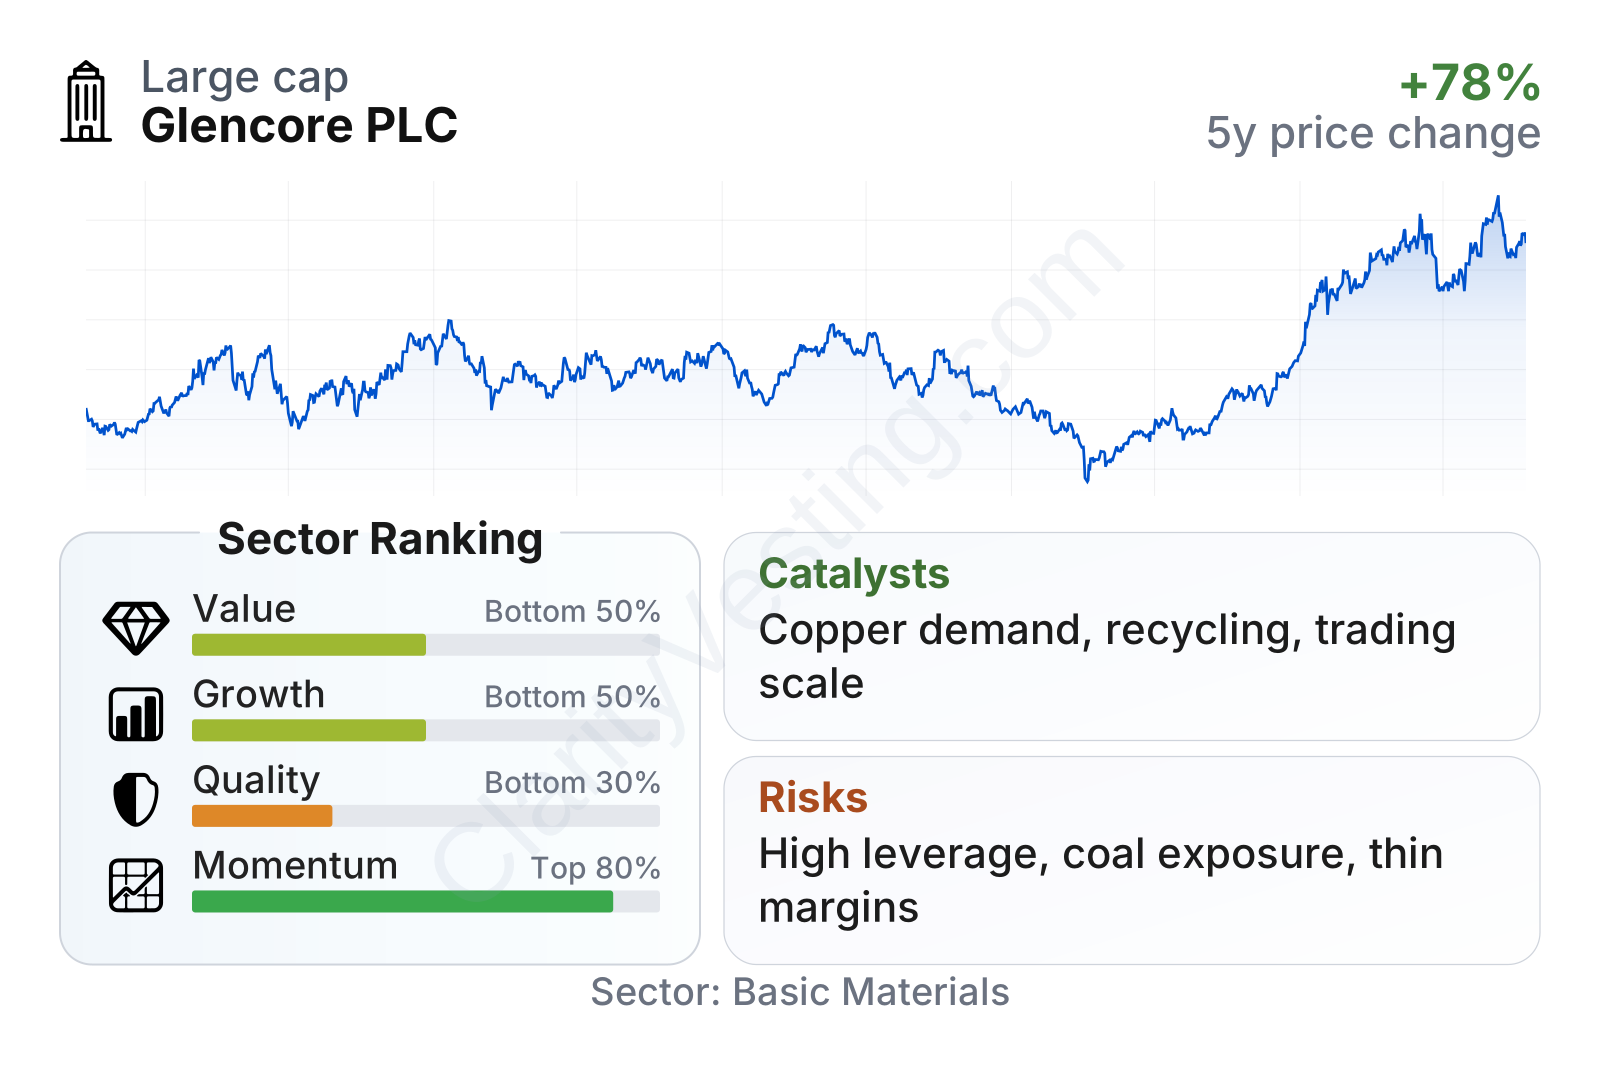
Glencore is a very large company in the materials sector, and its recent share price performance has been strong over the last year even after some volatility. The table points to a mixed profile. Valuation measures are not stretched versus the sector on earnings, and the dividend yield is slightly above the sector median, but free cash flow yield is notably weak. Growth indicators are uneven: revenue trends have been better than many peers, yet cash flow growth and dividend growth over five years have been soft. Quality metrics are the main weak point, with leverage above sector norms and profitability below many other materials companies. Momentum has been relatively strong, showing that the market has recently responded favorably despite those balance-sheet and margin concerns.
Growth
Glencore operates in markets that are strategically important for the global economy. Copper, nickel, zinc, and recycling are linked to electrification, grid expansion, renewable power equipment, electric vehicles, and industrial supply security. Even though commodity demand is cyclical, the long-term direction for several of Glencore’s metals is supported by rising electricity use, more transmission infrastructure, and the need for large volumes of conductive and battery-related materials.
The company’s strategy broadly makes sense for that backdrop. Its mining assets give direct exposure to resources that are difficult to replace, while its global marketing arm provides an additional engine tied to trade flows and supply chain complexity. That second piece matters because future growth does not depend only on higher metal prices or higher mine output. Disruptions, regional shortages, sanctions, and freight dislocations can also create opportunities for the marketing business.
Glencore has also been increasing its emphasis on recycling and transition-facing metals. That is important because recycled feedstock can become more valuable as manufacturers and governments seek lower-emission supply chains and a more secure domestic source of refined metals. This does not remove cyclicality, but it gives the company another route to participate in future demand growth.
Revenue growth has been volatile, which is normal for a commodity-linked company. After very strong expansion in 2021 and 2022, revenue contracted in 2023, then returned to modest growth in 2024 and was close to flat in the most recent period. That pattern suggests stabilization rather than a clean acceleration. The recent trailing growth rate shown in the metrics table is much stronger than the longer series, so readers should view it as potentially influenced by short-term commodity pricing and trading conditions rather than as a settled long-run pace.
A major catalyst for the coming years is copper. Glencore has repeatedly highlighted copper as a core material for electrification, and the industry widely faces permitting delays, declining ore grades, and limited supply growth. If copper markets tighten further, companies with existing production, development options, and trading reach may be in a stronger position. Another meaningful catalyst is any sustained rebound in industrial metals pricing after recent weakness in parts of the cycle.
Recent company developments also matter. Glencore has continued reshaping its portfolio after the Teck coal transaction and has been evaluating the structure of its coal and metals exposure. That matters because portfolio simplification, asset optimization, or clearer separation between transition metals and coal cash generation could change how the market assesses the business over time.
Risks
This article is for informational purposes only and does not constitute financial advice. Some content is AI-generated. See Disclaimer


