Stock Analysis · Glencore PLC (GLCNF)
Overview
Glencore is one of the world’s largest natural resources groups. It operates in two linked businesses: producing commodities from mines and industrial assets, and marketing those commodities through a global trading and logistics network. In simple terms, the company both extracts raw materials and helps move them around the world to customers such as smelters, power utilities, steelmakers, battery supply chains, and manufacturers.
This combination makes Glencore different from many mining peers. A pure miner depends mainly on production volumes and commodity prices, while Glencore also earns money from sourcing, transporting, blending, storing, and selling materials globally. That trading arm can sometimes soften the impact of weaker mining markets, although it also adds complexity.
Based on Glencore’s latest annual reporting, revenue is overwhelmingly generated by the marketing business, while earnings are more balanced between marketing and industrial assets depending on the commodity cycle. Approximate revenue sources are:
- Energy products: approximately 50% to 55% of revenue. This mainly includes coal and oil-related trading and sales, plus associated logistics.
- Metals and minerals: approximately 40% to 45% of revenue. This includes copper, zinc, lead, nickel, ferroalloys, alumina, iron ore, and related concentrates and refined products.
- Agricultural products: 0% after the completed separation of the former agriculture business.
Looking from the industrial production side rather than revenue alone, Glencore’s key profit-driving commodities are typically copper, coal, zinc, and nickel, with copper especially important for long-term strategic positioning because of its role in electrification, power grids, and transport infrastructure.
The business model is very high-volume and low-margin at the consolidated revenue level. That is why Glencore can report very large sales while still showing modest operating and net margins compared with many other sectors.
The long-term picture shows how sensitive results are to commodity cycles. Revenue stayed extremely large from 2021 through 2025, but profitability moved much more sharply. Gross profit and operating income surged in 2022 during favorable markets, then fell back materially in 2023 and 2024 even though sales remained high. That pattern reflects a business where scale is steady, but margins can swing widely.
Key Figures
| Metric | Value | Sector ⓘ |
|---|---|---|
| Date | Oct 10, 2026 | |
| Context | ||
| Sector | Basic Materials | |
| Industry | Other Industrial Metals & Mining | |
| Market Cap ⓘ | $89.35B | |
| Beta ⓘ | 0.57 | |
Value (Cheapness) | ||
| P/E Ratio ⓘ | 16.93 | 17.36 |
| P/B Ratio ⓘ | 1.93 | 1.73 |
| FCF Yield ⓘ | 0.35% | 5.81% |
| Dividend Yield ⓘ | 2.23% | 1.98% |
| EBIT / EV ⓘ | 6.42% | 6.34% |
| PEG ⓘ | 0.21 | |
Growth (Business expansion) | ||
| Revenue Growth ⓘ | 48.60% | 11.15% |
| RPS Growth (5Y CAGR) ⓘ | 7.66% | 4.49% |
| EPS Growth (5Y CAGR) ⓘ | N/A | -12.80% |
| BVPS Growth (5Y CAGR) ⓘ | 5.22% | 5.49% |
| Margin Growth (5Y Trend) ⓘ | -1.93% | -1.54% |
| FCF Growth (5Y CAGR) ⓘ | -47.59% | 0.20% |
| DPS Growth (5Y CAGR) ⓘ | -10.66% | 5.91% |
Quality (Business durability) | ||
| ROIC (Latest) ⓘ | 8.77% | 9.26% |
| ROA (Latest) ⓘ | 2.35% | 4.92% |
| ROIC (5Y Median) ⓘ | 4.83% | 7.82% |
| ROA (5Y Median) ⓘ | 3.33% | 3.88% |
| Net Debt / EBIT (Latest) ⓘ | 5.10 | 1.37 |
| Net Debt / EBIT (5Y Median) ⓘ | 5.32 | 1.70 |
| Net Debt / EBITDA (Latest) ⓘ | 1.86 | 0.92 |
| Net Debt / Assets ⓘ | 26.78% | 13.56% |
| EBITDA / Interest ⓘ | 4.25 | 12.28 |
| Operating Margin (Latest) ⓘ | 1.53% | 13.20% |
| Operating Margin (5Y Median) ⓘ | 2.95% | 11.82% |
| Debt to Equity (Latest) ⓘ | 108.47% | 39.91% |
| Profit Margin (Latest) ⓘ | 1.78% | 6.43% |
| Free Cash Flow (Latest) ⓘ | $315.94M | |
Momentum (Price trend) | ||
| 3Y Return ⓘ | +49.84% | +68.93% |
| 12M Return (excl. last month) ⓘ | +118.81% | +36.53% |
| 6M Return ⓘ | +5.93% | 0.00% |
| Price vs. 200-Day MA ⓘ | +7.31% | -0.18% |
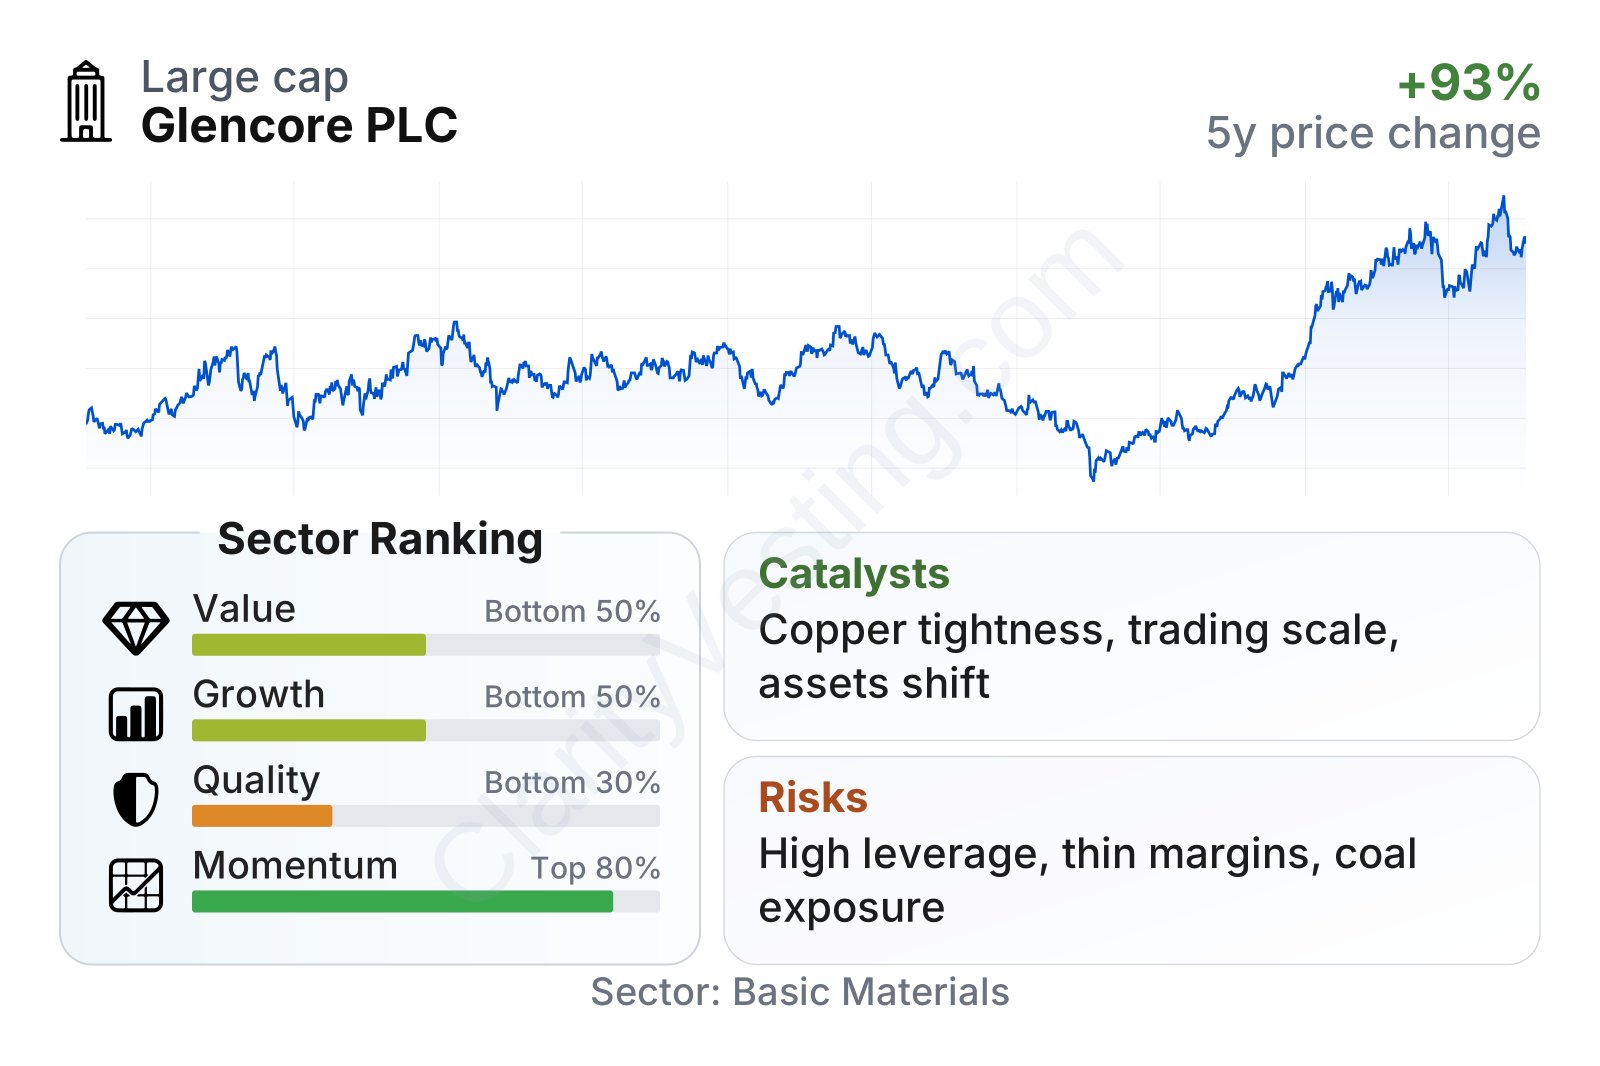
Glencore is a very large basic materials company, and its share price has been volatile, which is typical for a globally exposed commodity group. The metrics table points to a mixed profile. Valuation measures are around the sector middle to weaker side rather than deeply discounted, growth indicators are uneven, quality measures are held back by leverage and thin margins, while recent price momentum has been stronger than much of the sector.
The most important takeaway is that headline valuation does not look extreme, but the company’s current financial quality is constrained by low free cash flow yield, relatively high debt compared with many peers, and margins that sit well below the industry median. That combination makes the investment case more dependent on an improvement in commodity conditions and operating execution than on current profitability alone.
Growth
Glencore operates in several commodity markets with very different outlooks. The strongest structural growth angle is copper, followed by nickel and other materials tied to electrification, grid upgrades, renewable power systems, and data center expansion. These are areas where long-term demand is widely expected to rise because modern economies need more transmission equipment, wiring, battery materials, and industrial metals.
At the same time, Glencore still has major exposure to coal, which remains highly cash generative in some market conditions but faces a weaker long-term demand profile in many regions because of decarbonization policies. This creates a split profile: part of the company is exposed to future-facing metals, while another important part is linked to a commodity that can produce cash today but carries a less durable long-term narrative.
Strategically, Glencore’s model still makes sense for growth because it combines scarce physical assets with a large global merchandising platform. Its trading network can benefit from supply disruptions, regional shortages, and changing trade routes. In addition, Glencore has long emphasized copper expansion and portfolio reshaping. The proposed acquisition path around Teck’s steelmaking coal assets and the company’s ongoing focus on copper and battery-related materials have been part of that broader repositioning effort.
Revenue growth has been very strong over the longer measurement period, including a recent year-over-year figure far above the sector median. However, the historical trend also shows that growth is not linear. There was a boom phase in 2021 and 2022, then contraction in parts of 2023, followed by much flatter performance. That is consistent with commodity businesses: growth often reflects price moves as much as operational expansion.
A meaningful catalyst is copper market tightness. Many industry studies and company commentary point to a constrained global supply pipeline versus long-term demand needs. If Glencore increases copper production or captures stronger realized prices, that could matter more to long-term value creation than changes in total revenue alone. Another catalyst is optimization of the marketing business, which can benefit from market dislocations even when industrial conditions are mixed.
Recent company updates have also highlighted operational improvement efforts, project development, and portfolio simplification. None of these instantly transforms the business, but together they support the idea that Glencore is trying to shift more of its economic engine toward metals with stronger long-term relevance.
Risks
This article is for informational purposes only and does not constitute financial advice. Some content is AI-generated. See Disclaimer


