Stock Analysis · Glanbia PLC (GLAPY)
Overview
Glanbia PLC is an Irish nutrition company best known for sports nutrition, lifestyle nutrition, protein ingredients, and premix solutions used by both consumers and food manufacturers. In simple terms, part of the business sells branded products such as protein powders, bars, and supplements, while another part supplies nutritional ingredients and customized blends to other companies. Its activities are tied to long-running themes such as health, active lifestyles, high-protein diets, and demand for convenient nutrition.
Following recent portfolio changes, Glanbia is more focused than it used to be. The group has increasingly centered itself on higher-value nutrition categories rather than broad dairy exposure. That matters for long-term analysis because nutrition brands and specialized ingredients usually carry stronger margins and clearer growth drivers than commodity-heavy food operations.
The main revenue sources are now concentrated in two large areas, with branded nutrition representing the bigger piece and ingredient solutions making up the balance. Based on recent annual reporting, the mix is approximately:
- Performance Nutrition: about 65% to 70% of revenue. This includes branded sports and lifestyle nutrition products, with names such as Optimum Nutrition and think! sold through specialty retail, e-commerce, gyms, and large retail chains.
- Nutritional Solutions: about 30% to 35% of revenue. This unit provides premixes, vitamins, minerals, proteins, and custom formulations for food, beverage, supplement, and health-product companies.
Geographically, Glanbia has meaningful exposure to the United States, which is its largest market, while also operating across Europe and other international regions. The business model mixes consumer brands, business-to-business ingredient supply, and a manufacturing base that supports both scale and product development.
The income flow over recent years shows a company that expanded revenue strongly through 2023, then became smaller after portfolio reshaping, with margins staying meaningful and free cash generation remaining solid. The latest period also suggests a cleaner, more focused earnings profile than the older revenue base alone might imply.
Key Figures
| Metric | Value | Sector ⓘ |
|---|---|---|
| Date | Oct 17, 2026 | |
| Context | ||
| Sector | Consumer Defensive | |
| Industry | Packaged Foods | |
| Market Cap ⓘ | $5.95B | |
| Beta ⓘ | 0.51 | |
Value (Cheapness) | ||
| P/E Ratio ⓘ | 25.38 | 17.88 |
| P/B Ratio ⓘ | 3.01 | 1.29 |
| FCF Yield ⓘ | 11.39% | 12.39% |
| Dividend Yield ⓘ | 2.08% | 2.85% |
| EBIT / EV ⓘ | 9.97% | 6.43% |
| PEG ⓘ | 8.07 | |
Growth (Business expansion) | ||
| Revenue Growth ⓘ | 7.90% | 4.10% |
| RPS Growth (5Y CAGR) ⓘ | 2.29% | 6.18% |
| EPS Growth (5Y CAGR) ⓘ | N/A | -13.59% |
| BVPS Growth (5Y CAGR) ⓘ | 6.59% | 3.20% |
| Margin Growth (5Y Trend) ⓘ | 3.97% | -0.15% |
| FCF Growth (5Y CAGR) ⓘ | 17.62% | 4.10% |
| DPS Growth (5Y CAGR) ⓘ | 14.25% | 6.79% |
Quality (Business durability) | ||
| ROIC (Latest) ⓘ | 17.87% | 12.34% |
| ROA (Latest) ⓘ | 9.39% | 6.30% |
| ROIC (5Y Median) ⓘ | 8.91% | 10.49% |
| ROA (5Y Median) ⓘ | 5.65% | 5.44% |
| Net Debt / EBIT (Latest) ⓘ | 1.32 | 1.96 |
| Net Debt / EBIT (5Y Median) ⓘ | 2.20 | 2.35 |
| Net Debt / EBITDA (Latest) ⓘ | 0.90 | 1.38 |
| Net Debt / Assets ⓘ | 20.84% | 21.51% |
| EBITDA / Interest ⓘ | 14.43 | 9.46 |
| Operating Margin (Latest) ⓘ | 7.61% | 8.87% |
| Operating Margin (5Y Median) ⓘ | 6.18% | 9.53% |
| Debt to Equity (Latest) ⓘ | 63.69% | 72.35% |
| Profit Margin (Latest) ⓘ | 5.80% | 5.40% |
| Free Cash Flow (Latest) ⓘ | $677.46M | |
Momentum (Price trend) | ||
| 3Y Return ⓘ | +61.92% | +20.92% |
| 12M Return (excl. last month) ⓘ | +52.92% | +2.13% |
| 6M Return ⓘ | +14.60% | +1.26% |
| Price vs. 200-Day MA ⓘ | +33.09% | +1.39% |
Glanbia sits in the mid-sized range by market value and has shown relatively low share-price volatility, with a beta around 0.5. That lower volatility can fit the company’s defensive food-and-nutrition profile, although its business still has growth characteristics that make it more dynamic than a typical staple-food producer.
The overall picture from the latest metrics is mixed but generally respectable. Profitability and capital efficiency look healthy, with returns on capital and assets ahead of sector medians. Balance-sheet pressure also appears manageable, helped by leverage below the sector median and strong interest coverage. Free cash flow remains meaningful in absolute terms.
On growth, the short-term trend is stronger than the sector in several areas, especially recent revenue growth, margin improvement over five years, free cash flow expansion, and dividend growth. The weaker spot is that five-year revenue per share growth has been slower than the sector median, which reflects the company’s portfolio shifts and changing business mix rather than a simple straight-line expansion.
Valuation metrics suggest the market is assigning a premium to the company. The earnings multiple and book multiple are above sector medians, while dividend yield is below the sector median. That combination usually signals expectations for better quality, stronger brand positioning, or more durable future growth than the average packaged-food name.
Growth
Glanbia operates in a favorable part of the food and nutrition industry. Sports nutrition, active-lifestyle products, functional foods, protein supplementation, and customized health ingredients are all supported by broad consumer trends: aging populations seeking wellness support, younger consumers prioritizing fitness, and increasing interest in protein-rich and convenient products. These are not short-lived themes, and they extend beyond hardcore athletes into mainstream health consumption.
The company’s strategy also makes sense in this context. Branded nutrition offers consumer loyalty, pricing power, and room for product innovation, while nutritional solutions brings business-to-business relationships and formulation expertise. This two-part structure gives Glanbia both market reach and diversification within nutrition.
Recent years have also shown a strategic effort to simplify the group and focus on categories with better economics. That can improve long-term quality even if it reduces reported revenue in the short run. A smaller but more profitable and cash-generative company can be more attractive than a larger one with heavier commodity exposure.
Revenue growth has been uneven, which is important to understand correctly. Some large swings were linked to acquisitions, disposals, and changes in the business perimeter rather than purely underlying consumer demand. Even so, the latest trailing annual growth rate still stands above the sector median, which suggests the company remains capable of outperforming peers when adjusted for its transition period.
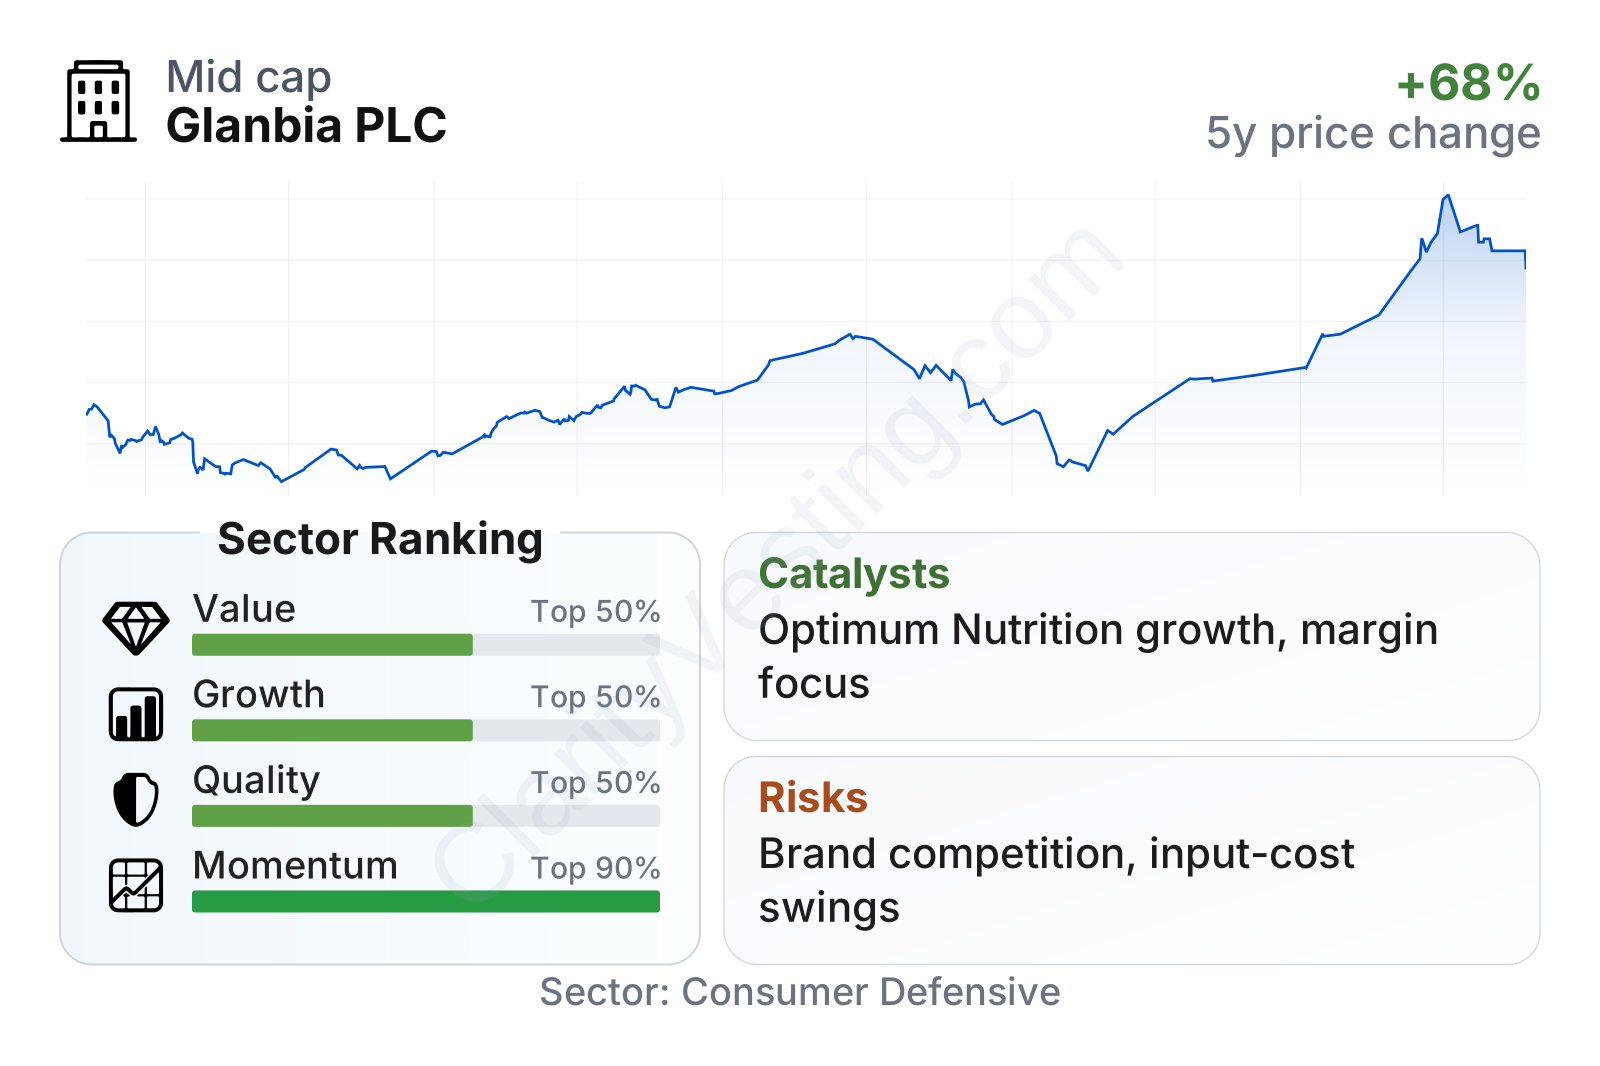
Potential catalysts include continued growth of Optimum Nutrition and other branded offerings, further expansion in convenient snacking and ready-to-mix formats, deeper penetration of e-commerce and international markets, and additional margin gains from operating focus. New product launches and bolt-on deals in adjacent nutrition categories could also matter because Glanbia already has a global distribution platform and formulation capabilities.
A notable positive signal in the broader financial profile is the strong multi-year rise in free cash flow and dividends, which indicates that growth has not relied only on accounting profits. Cash generation gives the company more flexibility for reinvestment, acquisitions, debt control, and shareholder distributions.
Risks
This article is for informational purposes only and does not constitute financial advice. Some content is AI-generated. See Disclaimer


