Stock Analysis · Grifols S.A (GIFLF)
Overview
Grifols S.A. is a Spanish healthcare company focused on plasma-derived medicines, diagnostic tools, and hospital pharmacy services. Its core business starts with collecting human plasma through a large network of donation centers, then turning that plasma into therapies used to treat immune deficiencies, neurological disorders, bleeding disorders, liver disease, and other serious conditions. This makes Grifols part manufacturer, part healthcare infrastructure operator, because access to plasma collection is a crucial part of the business model.
The company’s revenue is led by its Biopharma division, which includes the main plasma-derived therapies and a smaller portfolio of specialty pharmaceutical products. Based on the company’s recent annual reporting structure, the revenue mix is approximately the following:
- Biopharma: about 85% to 86% of revenue. This includes immunoglobulins, albumin, alpha-1 antitrypsin, clotting factors, and other plasma-based therapies.
- Diagnostic: about 8% to 9% of revenue. This segment provides transfusion medicine, clinical diagnostics, blood screening, and laboratory-related products.
- Bio Supplies: about 3% to 4% of revenue. This activity sells biological materials and intermediate products to other companies and research customers.
- Others, including hospital pharmacy-related activities: about 2% to 4% of revenue, depending on period and reporting scope.
Geographically, Grifols has historically been most exposed to the United States and Europe, with the U.S. especially important because it is the center of the global plasma collection system and one of the largest end markets for immunoglobulin therapies. That footprint matters because plasma medicines are not simple commodity products: they depend on collection scale, regulatory know-how, manufacturing capacity, and long relationships with hospitals and health systems.
The broad financial picture is that revenue has climbed meaningfully over the last several years, operating profit has improved, and net income has recovered from the weak levels seen in 2023. At the same time, interest expense has remained very large, which explains why the business can look much stronger at the operating level than at the bottom line.
The long-term pattern shows a business that has expanded sales from roughly $5.4 billion in 2021 to more than $8.2 billion in 2025, while operating income has more than doubled over that span. The weak point is financing cost: interest expense rose sharply through 2024 before easing in 2025, so debt remains one of the main lenses through which the company needs to be analyzed.
Key Figures
| Metric | Value | Sector ⓘ |
|---|---|---|
| Date | Nov 21, 2026 | |
| Context | ||
| Sector | Healthcare | |
| Industry | Drug Manufacturers - General | |
| Market Cap ⓘ | $8.66B | |
| Beta ⓘ | 1.13 | |
Value (Cheapness) | ||
| P/E Ratio ⓘ | 15.33 | 25.50 |
| P/B Ratio ⓘ | N/A | 4.14 |
| FCF Yield ⓘ | 10.07% | 2.68% |
| Dividend Yield ⓘ | N/A | 1.52% |
| EBIT / EV ⓘ | 8.92% | 2.99% |
| PEG ⓘ | 0.26 | |
Growth (Business expansion) | ||
| Revenue Growth ⓘ | 9.40% | 7.10% |
| RPS Growth (5Y CAGR) ⓘ | 10.75% | 8.61% |
| EPS Growth (5Y CAGR) ⓘ | -8.45% | -10.82% |
| BVPS Growth (5Y CAGR) ⓘ | -14.88% | 3.59% |
| Margin Growth (5Y Trend) ⓘ | 4.43% | -0.63% |
| FCF Growth (5Y CAGR) ⓘ | 29.05% | 1.59% |
| DPS Growth (5Y CAGR) ⓘ | -16.44% | 6.65% |
Quality (Business durability) | ||
| ROIC (Latest) ⓘ | 12.09% | 5.62% |
| ROA (Latest) ⓘ | 2.44% | 2.70% |
| ROIC (5Y Median) ⓘ | 5.18% | 4.51% |
| ROA (5Y Median) ⓘ | 1.02% | 1.78% |
| Net Debt / EBIT (Latest) ⓘ | 6.44 | 1.33 |
| Net Debt / EBIT (5Y Median) ⓘ | 11.42 | 2.00 |
| Net Debt / EBITDA (Latest) ⓘ | 4.84 | 0.99 |
| Net Debt / Assets ⓘ | 43.81% | 6.14% |
| EBITDA / Interest ⓘ | 3.45 | 9.65 |
| Operating Margin (Latest) ⓘ | 18.16% | 9.28% |
| Operating Margin (5Y Median) ⓘ | 13.29% | 7.24% |
| Debt to Equity (Latest) ⓘ | 161.91% | 28.47% |
| Profit Margin (Latest) ⓘ | 6.44% | 3.67% |
| Free Cash Flow (Latest) ⓘ | $872.01M | |
Momentum (Price trend) | ||
| 3Y Return ⓘ | -17.73% | +38.93% |
| 12M Return (excl. last month) ⓘ | -22.46% | +13.18% |
| 6M Return ⓘ | +21.43% | +10.51% |
| Price vs. 200-Day MA ⓘ | -14.28% | +3.72% |
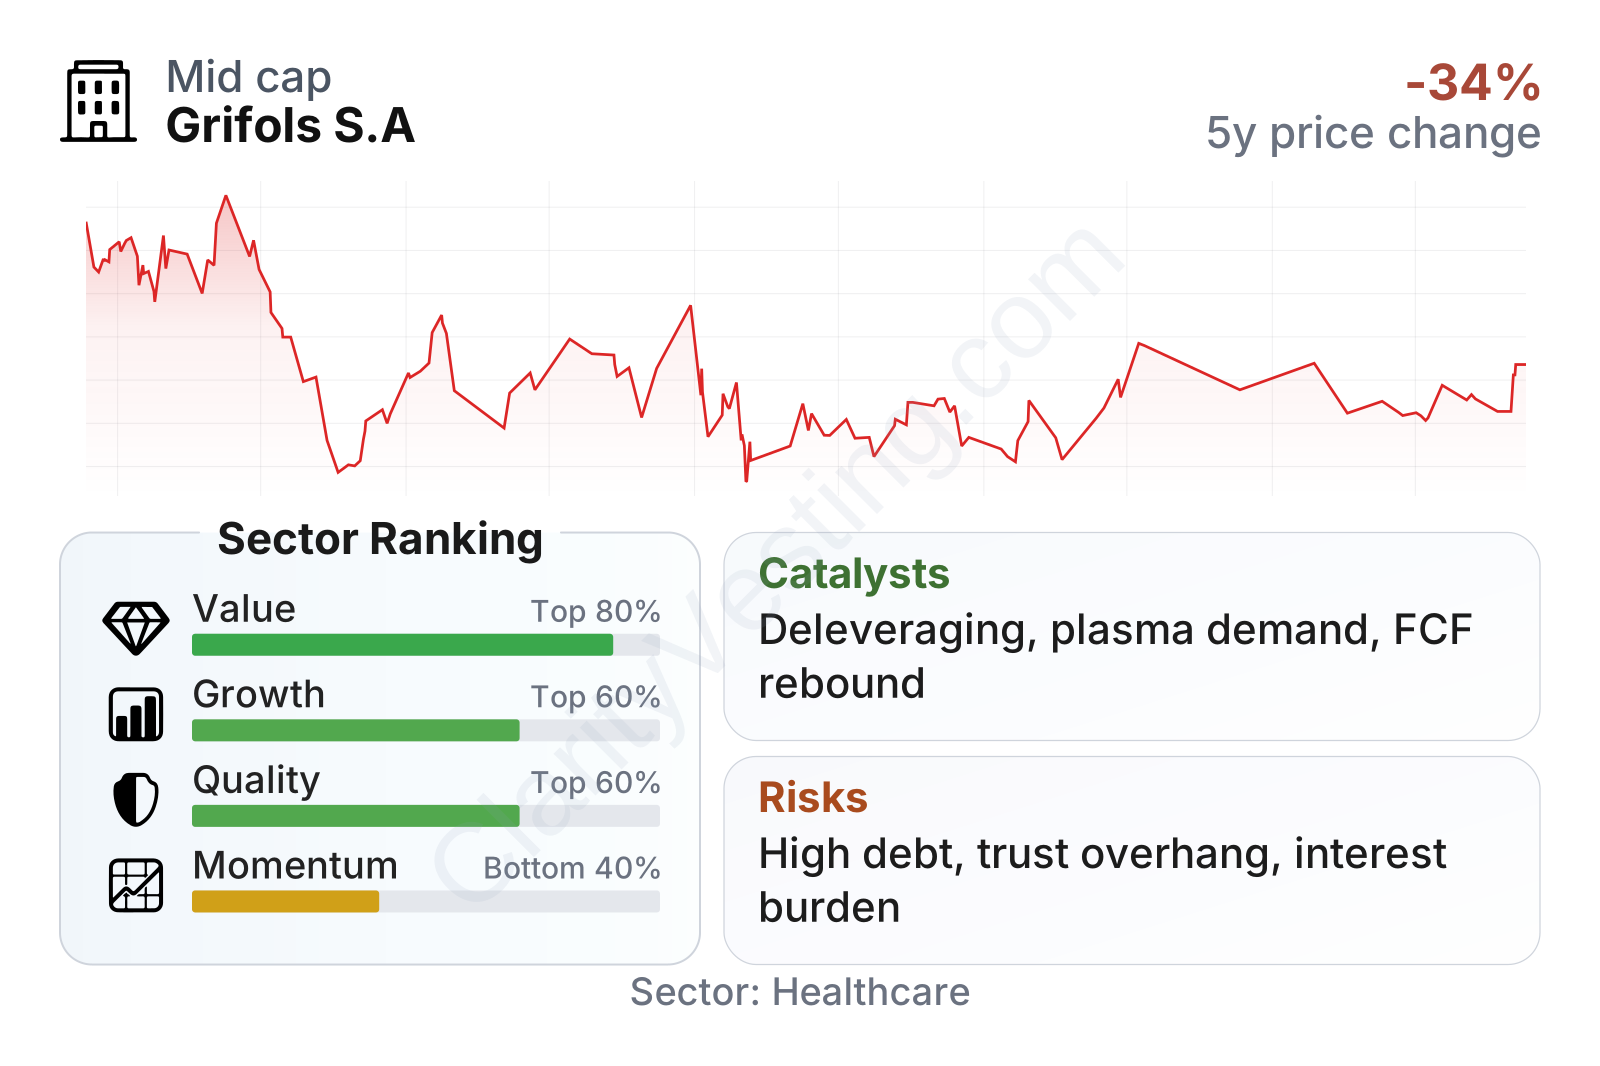
Grifols sits in an unusual position. On valuation measures, it screens cheaper than much of the healthcare sector, with a modest earnings multiple, a high free cash flow yield, and a very low PEG ratio. On growth and quality, the picture is more mixed but still constructive: revenue growth is slightly ahead of the sector median, margins are clearly stronger than the median, and return on invested capital is solid. The weak area is market performance, where the stock has trailed the broader healthcare group over multi-year and recent periods, showing that sentiment has not yet fully caught up with the operational recovery.
The stock price history also reflects that tension. Shares fell heavily from 2021 into 2023 and only partly recovered afterward. In other words, the market has continued to apply a discount despite better cash generation and improving profitability.
Growth
Grifols operates in a market with durable structural demand. Plasma-derived medicines are used in chronic and life-saving treatments, and demand for key products such as immunoglobulins has generally risen over time because of better diagnosis, broader treatment use, aging populations, and expanding healthcare access in some regions. Supply is harder to increase quickly because plasma collection, fractionation capacity, and regulatory approvals create long lead times. That combination can support growth for established operators.
The company’s strategy also makes industrial sense. Grifols controls an important part of its own raw material supply through plasma collection centers, then captures value again through processing and distribution. This vertical integration is valuable in a sector where shortages of collected plasma can damage production and margins. The group has also been emphasizing productivity, simplification, and deleveraging after a period when leverage became the dominant concern.
Recent revenue momentum suggests that the business has moved past the strongest phase of post-pandemic recovery and is now entering a more uneven growth stage. Sales growth accelerated nicely through much of 2024, slowed during 2025, and then turned mixed in 2026, with some quarters declining and others returning to healthier growth. That does not necessarily weaken the long-term case, but it does suggest that future expansion may depend more on product mix, pricing, execution, and new capacity than on a simple rebound effect.
Cash generation is one of the more encouraging developments. Free cash flow was weak and even negative at one point, but then improved sharply to a level above $800 million on a trailing basis. For a company carrying substantial debt, that matters far more than revenue growth alone because cash flow is what can fund debt reduction, interest payments, manufacturing investment, and strategic flexibility.
A meaningful catalyst is the continued normalization of plasma operations and collection economics compared with the more difficult period that followed the pandemic. Another is any sustained reduction in financing pressure through refinancing, asset sales, or debt paydown. Grifols has also highlighted portfolio focus and efficiency measures in recent corporate communications, which could help translate revenue into stronger earnings if execution remains consistent.
Recent company developments have largely centered on strengthening the balance sheet, simplifying the business, and defending the credibility of reported performance after a period of intense scrutiny. For long-term analysis, that is important because the next chapter for Grifols is less about proving that demand exists and more about proving that stronger operations can steadily convert into cleaner, less leveraged financial results.
Risks
This article is for informational purposes only and does not constitute financial advice. Some content is AI-generated. See Disclaimer