Stock Analysis · Global Industrial Co (GIC)
Overview
Global Industrial Co is a North American industrial distributor focused on products that help businesses operate facilities, warehouses, offices, and maintenance functions. In simple terms, it sells the everyday equipment and supplies organizations need to run their sites: storage and shelving, material handling equipment, safety products, HVAC items, janitorial supplies, furniture, packaging, and tools. The company mainly serves business, government, healthcare, and education customers through e-commerce, catalog, and relationship-based sales.
The business is relatively straightforward: Global Industrial buys a very broad range of products from suppliers, markets them through its digital platform and sales force, and earns money on the spread between sourcing costs and selling prices, while also benefiting from repeat purchasing by organizations that need recurring supplies.
Public filings indicate that the company reports as a single operating segment, so revenue is not broken out in a detailed official percentage mix by product line. Still, based on the way the company presents its assortment and customer demand, the main revenue sources can be described as follows:
- Material handling and storage equipment — a major category including shelving, racks, carts, lift tables, workbenches, and warehouse efficiency products.
- Facilities maintenance products — MRO-related items such as cleaning, plumbing, electrical, HVAC, and building maintenance supplies.
- Safety and security — personal protective equipment, traffic and crowd control, first-aid, and workplace safety items.
- Furniture and workspace products — office furniture, industrial seating, lockers, and breakroom equipment.
- Packaging and shipping supplies — boxes, mailers, labels, and warehouse consumables.
- Private-label products and other categories — a mix of company-branded items and additional niche industrial supplies.
Financially, the company has grown revenue steadily over the last several years, moving from just above $1.0 billion in 2021 to about $1.38 billion in 2025. Gross profit has also expanded over that period, although operating costs have risen enough to keep earnings growth less consistent. One positive feature is that interest expense has remained minimal, reflecting a balance sheet with limited leverage.
The overall picture is of a mid-sized distributor with a broad catalog, recurring business demand, and a business model that is easier to understand than many industrial companies because it does not rely on heavy manufacturing or large project execution.
Key Figures
| Metric | Value | Sector ⓘ |
|---|---|---|
| Date | Oct 17, 2026 | |
| Context | ||
| Sector | Industrials | |
| Industry | Industrial Distribution | |
| Market Cap ⓘ | $1.69B | |
| Beta ⓘ | 0.76 | |
Value (Cheapness) | ||
| P/E Ratio ⓘ | 19.77 | 22.10 |
| P/B Ratio ⓘ | 4.88 | 1.97 |
| FCF Yield ⓘ | 5.18% | 6.38% |
| Dividend Yield ⓘ | 2.48% | 1.94% |
| EBIT / EV ⓘ | 7.20% | 4.79% |
| PEG ⓘ | 1.11 | |
Growth (Business expansion) | ||
| Revenue Growth ⓘ | 7.70% | 9.30% |
| RPS Growth (5Y CAGR) ⓘ | 6.44% | 7.81% |
| EPS Growth (5Y CAGR) ⓘ | -18.91% | -13.06% |
| BVPS Growth (5Y CAGR) ⓘ | 19.18% | 6.14% |
| Margin Growth (5Y Trend) ⓘ | -1.17% | 0.88% |
| FCF Growth (5Y CAGR) ⓘ | 12.60% | 11.01% |
| DPS Growth (5Y CAGR) ⓘ | -10.62% | 9.48% |
Quality (Business durability) | ||
| ROIC (Latest) ⓘ | 26.25% | 10.84% |
| ROA (Latest) ⓘ | 14.15% | 5.41% |
| ROIC (5Y Median) ⓘ | 55.92% | 9.38% |
| ROA (5Y Median) ⓘ | 14.60% | 4.95% |
| Net Debt / EBIT (Latest) ⓘ | 0.11 | 2.08 |
| Net Debt / EBIT (5Y Median) ⓘ | 0.63 | 2.27 |
| Net Debt / EBITDA (Latest) ⓘ | 0.10 | 1.39 |
| Net Debt / Assets ⓘ | 1.94% | 19.28% |
| EBITDA / Interest ⓘ | N/A | 9.58 |
| Operating Margin (Latest) ⓘ | 8.03% | 10.50% |
| Operating Margin (5Y Median) ⓘ | 7.56% | 10.29% |
| Debt to Equity (Latest) ⓘ | 28.86% | 65.48% |
| Profit Margin (Latest) ⓘ | 6.07% | 6.67% |
| Free Cash Flow (Latest) ⓘ | $87.30M | |
Momentum (Price trend) | ||
| 3Y Return ⓘ | +43.58% | +61.68% |
| 12M Return (excl. last month) ⓘ | +9.92% | +12.58% |
| 6M Return ⓘ | +33.69% | 0.00% |
| Price vs. 200-Day MA ⓘ | +29.65% | +0.02% |
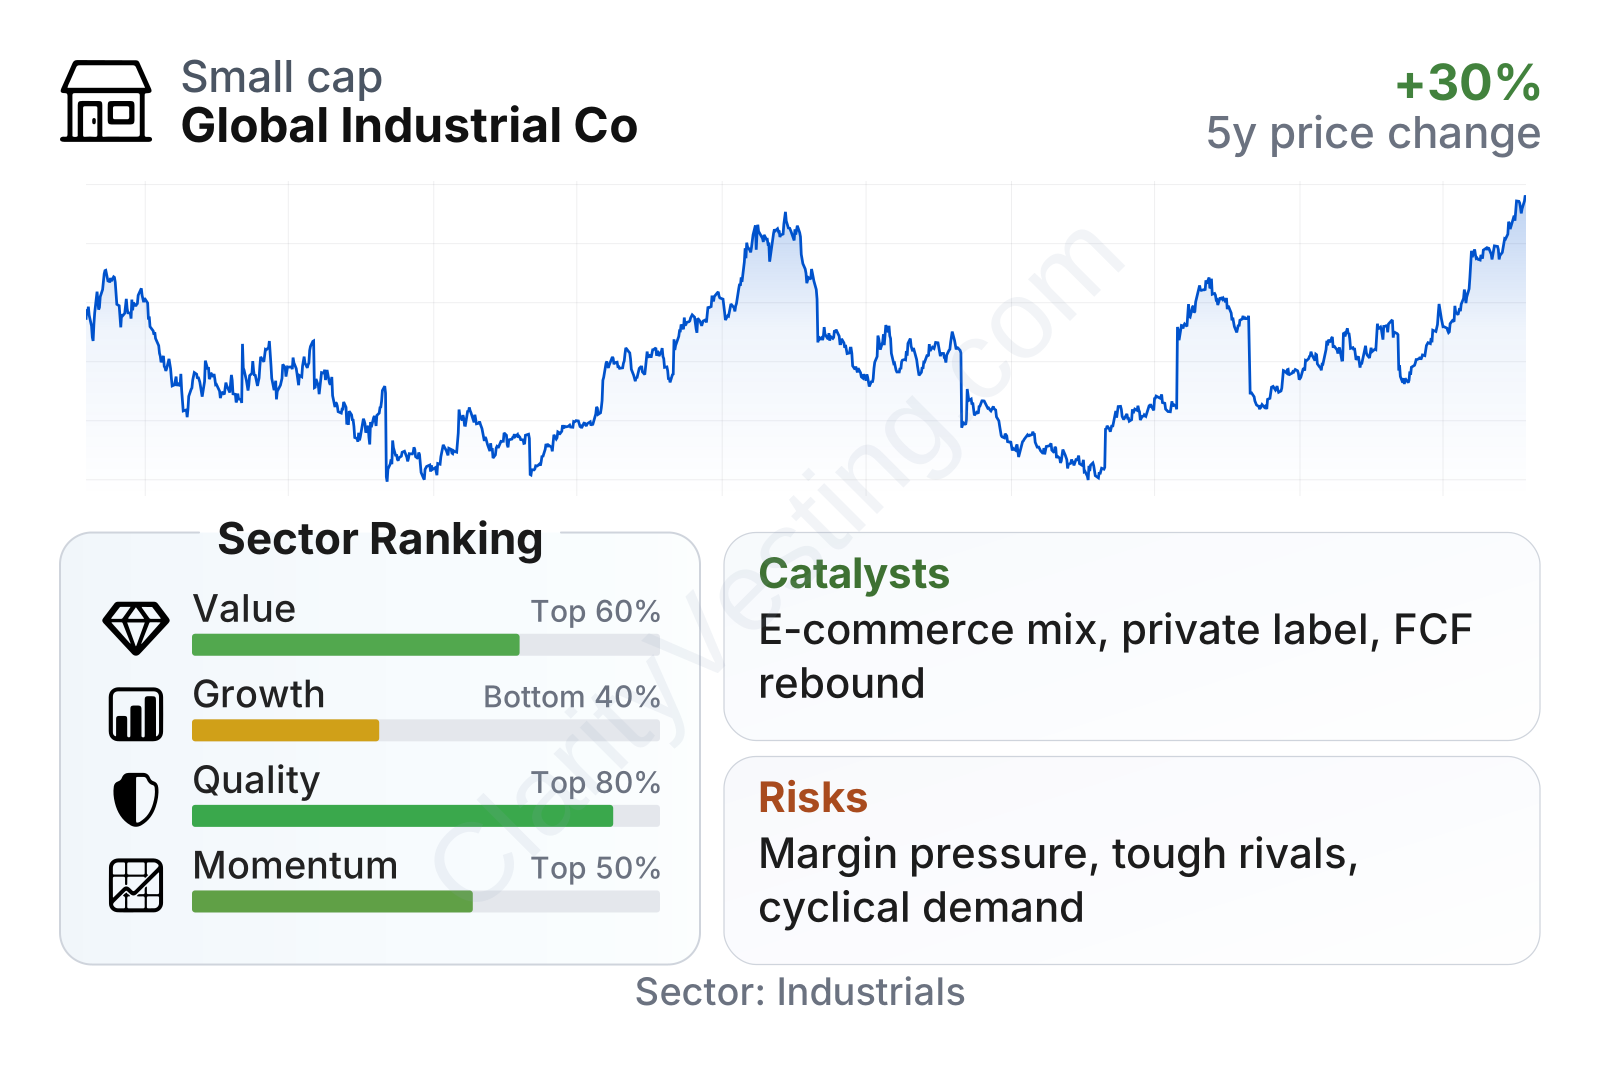
Global Industrial stands out more for balance-sheet strength and capital efficiency than for rapid expansion. The company ranks well on quality, supported by returns on capital that are well above typical industrial peers and by very low net debt. Growth is less impressive relative to the sector, while valuation looks mixed: the earnings multiple is below the sector median, but the price-to-book ratio is noticeably higher, suggesting the market assigns value to its profitability and asset-light distribution model. Share-price behavior has also been volatile over the last few years, though recent momentum has been stronger than much of the sector.
Growth
Industrial distribution is not usually a high-growth industry, but it can be a durable one. Demand is tied to warehouse activity, facility upgrades, maintenance spending, workplace safety, and the steady replacement of business equipment. That creates a large addressable market with recurring needs, even if growth tends to track the broader economy more than fast-moving technology sectors do.
Global Industrial’s strategy appears sensible for this kind of market. The company emphasizes a broad product assortment, a digital-first selling model, private-label development, and service for institutional and business buyers that often place recurring orders. That approach can support long-term growth by increasing customer retention and by improving margins on owned brands. It also fits a market where buyers increasingly want procurement to be quick, online, and integrated with routine operations.
Recent revenue growth has returned to a positive pace after a softer stretch in 2024. The latest year-over-year trend is in the high-single-digit range, which is not exceptional for the sector but does suggest that demand has stabilized and improved. Over a five-year view, revenue per share has grown at a mid-single-digit annual pace, showing that the company has been able to expand, even if not as quickly as many industrial peers.
Cash generation is another supportive element. Free cash flow has been positive and has recovered from a dip seen in 2025, with trailing twelve-month cash flow back to a healthier level in 2026. Over five years, free cash flow has compounded at a double-digit pace, which matters because distribution businesses need working capital discipline to translate revenue into cash.
A meaningful catalyst is the continued shift of industrial purchasing toward digital channels. Global Industrial already operates with a strong e-commerce orientation, and that can help it win share from smaller local distributors that may be less technologically developed. Private-label expansion is another potential opportunity because owned brands can strengthen customer loyalty and support profitability. In addition, any improvement in warehouse investment, reshoring-related infrastructure needs, or institutional spending could provide incremental demand across multiple product categories.
Recent company communications in 2026 have also pointed to ongoing efforts around assortment expansion, customer experience, and operational execution rather than transformational acquisitions or dramatic strategic changes. That usually means the opportunity is more about steady compounding than about a single breakthrough event.
Risks
This article is for informational purposes only and does not constitute financial advice. Some content is AI-generated. See Disclaimer


