Stock Analysis · GF Securities Co. Ltd (GFSEF)
Overview
GF Securities Co. Ltd is a large Chinese securities firm. In simple terms, it is a financial company that helps people and institutions invest, trade securities, raise money, manage wealth, and handle other capital markets activities. Its business spans brokerage, wealth management, investment banking, trading, asset management, margin financing, futures, and other financial services. The company is listed in Shenzhen and Hong Kong, while GFSEF is the U.S. over-the-counter line.
Its revenue mix can move meaningfully from year to year because securities firms are exposed to trading activity, market sentiment, investment gains and losses, and capital-raising cycles. Based on the company’s recent annual disclosures, the largest sources of revenue and other income are broadly the following:
- Wealth management and brokerage: approximately 30% to 40% of operating revenue in a typical year. This includes commission income from stock and fund trading, distribution of financial products, margin financing, securities lending, and client account-related services.
- Trading and investment income: approximately 25% to 35%. This includes proprietary trading, market-making, gains from financial instruments, and investment-related income that can fluctuate with market conditions.
- Investment banking: approximately 10% to 20%. This covers equity and debt underwriting, sponsorship, and advisory work for corporate clients.
- Asset management: approximately 10% to 15%. This includes management fees from public and private asset management products and institutional mandates.
- Other business lines: approximately 10% to 15%. This can include futures, private equity-related activities, interest income, and other supporting financial services.
That mix matters because it shows GF Securities is not a single-product business. It combines relatively recurring fee businesses, such as wealth and asset management, with more cyclical activities such as trading and investment banking.
The longer-term operating picture looks better than the short-term noise might suggest. Revenue and net income improved strongly into 2025, while overhead remained comparatively controlled. Interest expense is still a meaningful cost for the business, which is normal for a broker that uses balance sheet funding, but the recent rise in profit indicates better operating leverage when market conditions are supportive.
Key Figures
| Metric | Value | Sector ⓘ |
|---|---|---|
| Date | Nov 21, 2026 | |
| Context | ||
| Sector | Financial Services | |
| Industry | Capital Markets | |
| Market Cap ⓘ | $15.65B | |
| Beta ⓘ | 0.89 | |
Value (Cheapness) | ||
| P/E Ratio ⓘ | 7.41 | 12.01 |
| P/B Ratio ⓘ | N/A | 1.48 |
| FCF Yield ⓘ | -33.49% | 8.77% |
| Dividend Yield ⓘ | 37.50% | 3.01% |
| EBIT / EV ⓘ | N/A | 8.31% |
| PEG ⓘ | N/A | |
Growth (Business expansion) | ||
| Revenue Growth ⓘ | -4.10% | 6.70% |
| RPS Growth (5Y CAGR) ⓘ | 12.18% | 12.35% |
| EPS Growth (5Y CAGR) ⓘ | N/A | -0.27% |
| BVPS Growth (5Y CAGR) ⓘ | 9.12% | 4.83% |
| Margin Growth (5Y Trend) ⓘ | N/A | -4.16% |
| FCF Growth (5Y CAGR) ⓘ | N/A | 4.69% |
| DPS Growth (5Y CAGR) ⓘ | 0.37% | 8.82% |
Quality (Business durability) | ||
| ROIC (Latest) ⓘ | N/A | 9.49% |
| ROE (Latest) ⓘ | 11.69% | 14.02% |
| ROA (Latest) ⓘ | 1.78% | 1.53% |
| ROIC (5Y Median) ⓘ | N/A | 7.80% |
| ROE (5Y Median) ⓘ | 7.06% | 12.09% |
| ROA (5Y Median) ⓘ | 1.34% | 1.28% |
| Net Debt / EBIT (Latest) ⓘ | N/A | 0.88 |
| Net Debt / EBIT (5Y Median) ⓘ | N/A | 0.73 |
| Net Debt / EBITDA (Latest) ⓘ | N/A | 0.71 |
| Operating Margin (Latest) ⓘ | N/A | 23.37% |
| Operating Margin (5Y Median) ⓘ | N/A | 24.29% |
| Debt to Equity (Latest) ⓘ | N/A | 59.34% |
| Profit Margin (Latest) ⓘ | 40.09% | 26.65% |
| Free Cash Flow (Latest) ⓘ | -$5.24B | |
Momentum (Price trend) | ||
| 3Y Return ⓘ | +5.88% | +73.29% |
| 12M Return (excl. last month) ⓘ | +2.67% | +18.35% |
| 6M Return ⓘ | +5.75% | +3.24% |
| Price vs. 200-Day MA ⓘ | +2.90% | +2.17% |
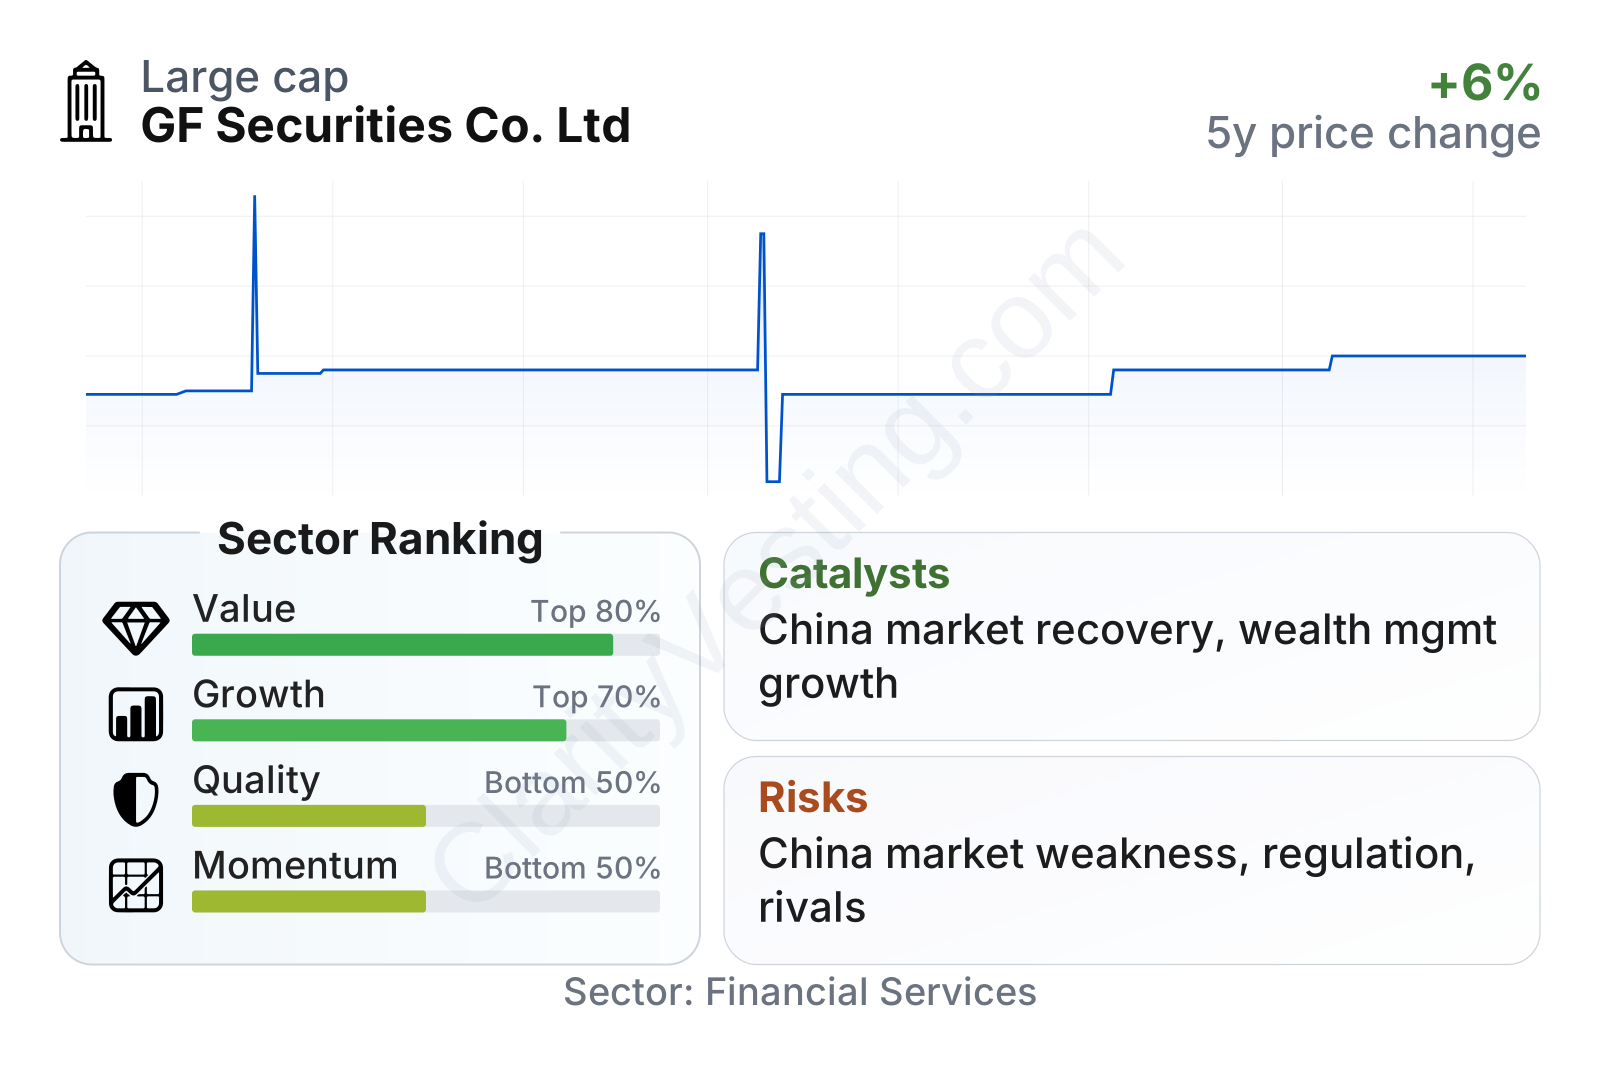
GF Securities sits in the large-cap range for its market, with a share price that has been relatively stable over the last year rather than strongly re-rated. On valuation, earnings-based multiples appear low versus much of the sector, helped by a price-to-earnings ratio around 7.4. The dividend yield is unusually high on a trailing basis, but this should be read carefully because payout levels can vary and cross-market data on Chinese brokers can sometimes look unusually elevated in ADR or OTC formats.
The quality profile is mixed. Profit margin is strong and above the sector median, and return on assets is slightly better than the median, but return on equity is below the sector median and free cash flow is negative. For a securities firm, cash flow can be noisy because balance sheet movements and client-related funding can distort the usual industrial-company interpretation, so book value growth and profitability often give a clearer read than free cash flow alone.
Growth indicators are also mixed. The most recent year-over-year revenue change was slightly negative, but the five-year trends for revenue per share and book value per share have been solid, with book value compounding faster than the sector median. Momentum is weaker than much of the sector, which suggests the market has not fully rewarded the underlying business recovery.
Growth
GF Securities operates in a sector that should keep growing over the long run, even if the path is uneven. China’s capital markets continue to deepen, household financial assets are gradually shifting beyond bank deposits, and regulators have pushed the market toward more institutional participation, product variety, and direct financing. All of that creates room for larger full-service brokers that already have nationwide platforms, research capability, and multiple licenses.
The company’s strategy appears sensible for that environment. A broad model that combines wealth management, institutional brokerage, investment banking, asset management, and trading can work well in China because different business lines often peak at different times. When underwriting is weak, brokerage or wealth management can help stabilize results; when markets are active, trading and capital markets can provide upside.
One of the clearest encouraging signs is the buildup in earnings and net assets. Profit improved sharply in 2025, and book value per share has been moving upward year after year. That matters for a broker because balance sheet strength supports margin financing, market activity, underwriting capacity, and client confidence.
The recent earnings trend points to improving profitability rather than just a one-off stabilization. Even a modest increase in earnings per share can matter for a low-multiple financial stock, because it changes how sustainable the current valuation looks.
The steady rise in book value per share is a particularly relevant signal for this kind of company. For financial firms, book value is often a practical anchor because it reflects retained earnings, capital strength, and the platform’s ability to support future activity. GF Securities has grown this measure at a pace meaningfully above the sector median over the last five years.
Potential catalysts also exist at the industry level. A stronger domestic equity market, more fundraising activity, recovery in deal issuance, increased retail participation, and further expansion of wealth management products would all support the company’s revenue mix. In addition, policy efforts in China aimed at improving capital market activity can benefit established brokers with broad distribution and institutional reach.
Risks
This article is for informational purposes only and does not constitute financial advice. Some content is AI-generated. See Disclaimer