Stock Analysis · GE Vernova LLC (GEV)
Overview
GE Vernova is an energy equipment and services company created from General Electric’s power and renewable businesses. Its activities are centered on how electricity is generated, moved, and managed. The company sells gas and steam turbines, wind turbines, grid equipment, electrification systems, software, and long-term service agreements. In simple terms, it is positioned across much of the power value chain: from generation to transmission to ongoing maintenance.
Its revenue base is fairly diversified across three main operating segments, with services playing an important role because many installed machines require maintenance over long periods.
- Power: approximately 45% to 50% of revenue. This includes gas turbines, steam technology, nuclear-related activities, and a large installed base of equipment that generates recurring service revenue.
- Wind: approximately 25% to 30% of revenue. This covers onshore wind turbines, offshore wind projects, and related services. This segment has historically been more volatile than Power.
- Electrification: approximately 20% to 25% of revenue. This includes grid systems, substations, switchgear, power conversion, and other equipment used to connect and manage electricity networks.
- Other and corporate items: a small remainder, generally linked to inter-segment and corporate activities.
This mix matters for long-term analysis. Power provides scale and profitability, Electrification adds exposure to grid investment, and Wind gives access to renewable energy growth, even if that business has been the least stable.
The financial flow over the last several years also shows a meaningful improvement in execution. Revenue moved from roughly the low-$30 billions to about $38 billion by 2025, while operating results shifted from losses earlier in the period to clear profitability more recently. Gross profit expanded faster than revenue, suggesting better pricing, project discipline, and mix.
Key Figures
| Metric | Value | Sector ⓘ |
|---|---|---|
| Date | Oct 03, 2026 | |
| Context | ||
| Sector | Industrials | |
| Industry | Specialty Industrial Machinery | |
| Market Cap ⓘ | $256.34B | |
| Beta ⓘ | 0.97 | |
Value (Cheapness) | ||
| P/E Ratio ⓘ | 27.25 | 22.45 |
| P/B Ratio ⓘ | 23.76 | 1.98 |
| FCF Yield ⓘ | 4.85% | 6.31% |
| Dividend Yield ⓘ | 0.18% | 1.96% |
| EBIT / EV ⓘ | 3.13% | 4.81% |
| PEG ⓘ | 1.86 | |
Growth (Business expansion) | ||
| Revenue Growth ⓘ | 21.90% | 9.10% |
| RPS Growth (5Y CAGR) ⓘ | 3.26% | 7.75% |
| EPS Growth (5Y CAGR) ⓘ | 42.26% | -13.59% |
| BVPS Growth (5Y CAGR) ⓘ | 0.77% | 6.22% |
| Margin Growth (5Y Trend) ⓘ | N/A | 0.72% |
| FCF Growth (5Y CAGR) ⓘ | N/A | 10.98% |
| DPS Growth (5Y CAGR) ⓘ | N/A | 9.48% |
Quality (Business durability) | ||
| ROIC (Latest) ⓘ | 72.29% | 10.92% |
| ROA (Latest) ⓘ | 14.10% | 5.41% |
| ROIC (5Y Median) ⓘ | N/A | 9.21% |
| ROA (5Y Median) ⓘ | 3.18% | 4.94% |
| Net Debt / EBIT (Latest) ⓘ | -1.20 | 2.07 |
| Net Debt / EBIT (5Y Median) ⓘ | N/A | 2.28 |
| Net Debt / EBITDA (Latest) ⓘ | -1.06 | 1.43 |
| Net Debt / Assets ⓘ | -11.34% | 19.27% |
| EBITDA / Interest ⓘ | N/A | 9.53 |
| Operating Margin (Latest) ⓘ | 18.39% | 10.50% |
| Operating Margin (5Y Median) ⓘ | -0.10% | 10.27% |
| Debt to Equity (Latest) ⓘ | 33.12% | 65.48% |
| Profit Margin (Latest) ⓘ | 23.04% | 6.62% |
| Free Cash Flow (Latest) ⓘ | $12.44B | |
Momentum (Price trend) | ||
| 3Y Return ⓘ | N/A | +58.56% |
| 12M Return (excl. last month) ⓘ | +46.92% | +15.63% |
| 6M Return ⓘ | +8.94% | +4.19% |
| Price vs. 200-Day MA ⓘ | +4.00% | +0.93% |
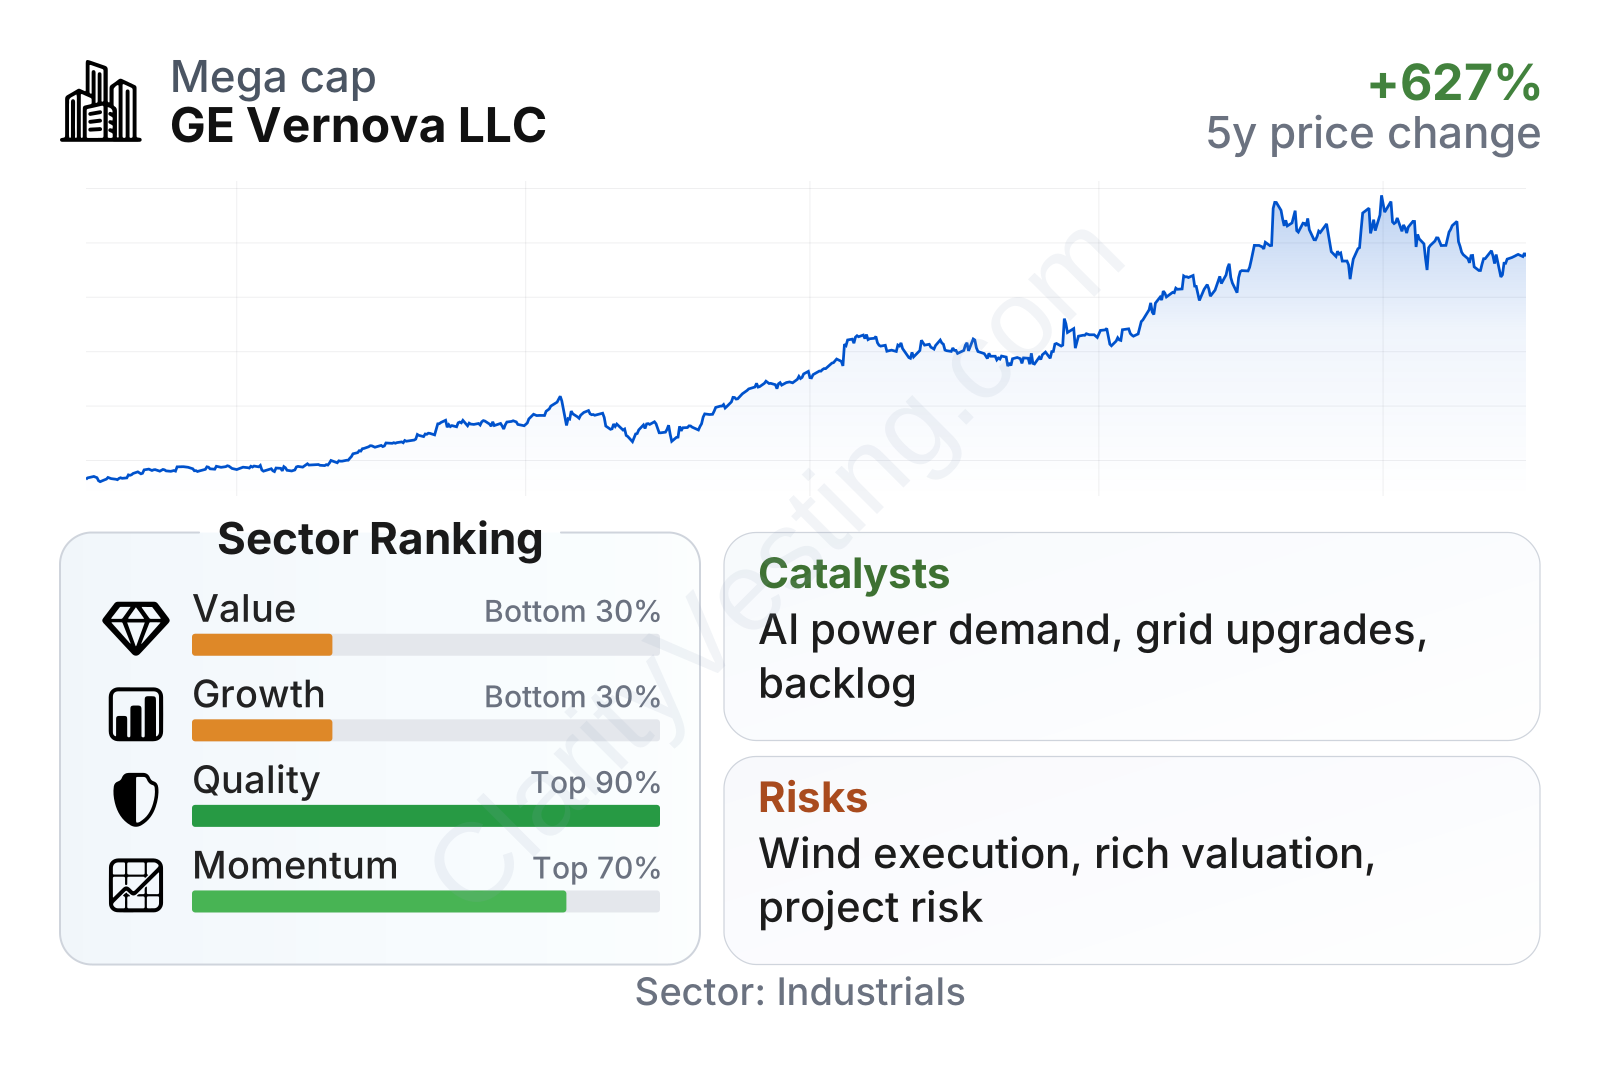
GE Vernova is now a very large industrial company, and its stock has risen sharply since becoming an independent public company. The market is assigning a premium to the business compared with much of the industrial sector. On the operating side, the picture is mixed but interesting: growth and cash generation have improved, leverage remains modest, and current profitability looks strong. At the same time, some quality and valuation indicators still look uneven versus the broader sector because the company is emerging from a multi-year restructuring and margin recovery phase rather than a long period of stable performance.
Growth
GE Vernova operates in parts of the economy that are supported by powerful long-term demand drivers. Electricity demand is rising in many regions, grid infrastructure needs modernization, and power systems are being expanded to integrate renewables, data centers, and industrial electrification. That creates room for investment in both generation equipment and the networks that deliver power.
The company’s strategy broadly fits those trends. It is not dependent on a single technology. Instead, it participates in gas power, wind, and electrification. That matters because many power systems are evolving in a mixed way: countries still need dispatchable generation such as gas turbines for reliability, while also building more renewable capacity and strengthening transmission networks.
The most convincing sign of momentum is that growth has accelerated recently. Year-over-year revenue growth was modest in late 2024, moved into the low double digits through much of 2025, and then accelerated further into 2026, reaching more than 20% in the latest reading. That suggests demand is not only present, but currently translating into reported sales.
Cash generation has improved even faster than revenue. Trailing free cash flow climbed from under $3 billion in late 2024 to above $7 billion by early 2026, and the latest summary points to an even higher level on a trailing basis. For an industrial business, that is important because free cash flow is what remains after operating needs and capital spending. It gives a clearer view of how much financial flexibility the company actually has.
A strong catalyst is the need for more power capacity tied to AI infrastructure and data centers. These facilities require large and reliable electricity supply, which can favor gas turbines, grid equipment, and power management systems. GE Vernova is one of the few companies with broad capabilities in those areas. Another catalyst is grid spending: aging transmission and distribution systems need upgrades, and the company’s Electrification business is directly exposed to that trend.
Recent company communications have also pointed to a sizable backlog and improving execution, especially in businesses tied to power and grid equipment. That does not remove cyclicality, but it does support the idea that recent growth is backed by multi-year demand rather than short-lived orders.
Risks
This article is for informational purposes only and does not constitute financial advice. Some content is AI-generated. See Disclaimer