Stock Analysis · Genesis Energy LP (GEL)
Overview
Genesis Energy LP is a midstream energy company. In simple terms, it owns and operates infrastructure that helps move, process, and market energy-related products rather than mainly drilling for oil and gas itself. Its assets are concentrated in the Gulf Coast and offshore Gulf of America region, where it provides services that are difficult to replace once pipelines, marine terminals, and processing systems are in place.
The partnership reports its business through several operating segments. Based on the company’s recent annual disclosures, the largest earnings contributors are typically its offshore pipeline transportation system and its soda ash business, while marine transportation and onshore facilities add meaningful but smaller contributions. Revenue can move differently from cash flow because some segments, especially marketing-related operations, carry large pass-through sales values but lower margins. For a long-term review, adjusted EBITDA mix is often more useful than headline revenue mix.
The business can be understood through these main sources of earnings, ordered from largest to smallest on a recent adjusted EBITDA basis, using approximate weights that can shift by quarter:
- Offshore pipeline transportation: about 35% to 40% — crude oil and natural gas pipeline systems serving deepwater production in the Gulf, including transportation and handling services tied to offshore fields.
- Soda ash and sulfur services: about 30% to 35% — natural soda ash mining and processing, plus sulfur removal and related services. Soda ash is used in glass, detergents, and other industrial products.
- Marine transportation: about 15% to 20% — inland and offshore barges moving crude oil and refined products.
- Onshore facilities and transportation: about 10% to 15% — terminals, pipelines, rail loading, and storage assets mainly linked to crude oil and refinery logistics.
That mix matters because Genesis is not only an oil-price-sensitive business. A meaningful part of its cash generation comes from fee-based transportation and industrial minerals exposure, which can make results more resilient than a pure producer, even though energy cycles still influence volumes and customer activity.
The long-term pattern shows a business with large revenue swings but a much steadier operating core than the top line suggests. Revenue dropped sharply in 2025, yet operating income held up better than net income because interest expense remained heavy. That reinforces a key point for Genesis: asset cash generation has improved, but financing costs still absorb a large share of the benefit.
Key Figures
| Metric | Value | Sector ⓘ |
|---|---|---|
| Date | Oct 17, 2026 | |
| Context | ||
| Sector | Energy | |
| Industry | Oil & Gas Midstream | |
| Market Cap ⓘ | $1.77B | |
| Beta ⓘ | 0.81 | |
Value (Cheapness) | ||
| P/E Ratio ⓘ | 72.50 | 15.44 |
| P/B Ratio ⓘ | N/A | 1.73 |
| FCF Yield ⓘ | 19.45% | 8.20% |
| Dividend Yield ⓘ | 5.05% | 3.59% |
| EBIT / EV ⓘ | 8.12% | 7.46% |
| PEG ⓘ | 3.05 | |
Growth (Business expansion) | ||
| Revenue Growth ⓘ | 41.00% | 26.90% |
| RPS Growth (5Y CAGR) ⓘ | -6.39% | 6.90% |
| EPS Growth (5Y CAGR) ⓘ | N/A | -15.73% |
| BVPS Growth (5Y CAGR) ⓘ | -41.09% | 6.07% |
| Margin Growth (5Y Trend) ⓘ | 13.58% | 0.58% |
| FCF Growth (5Y CAGR) ⓘ | N/A | 1.86% |
| DPS Growth (5Y CAGR) ⓘ | 0.71% | 16.79% |
Quality (Business durability) | ||
| ROIC (Latest) ⓘ | 12.25% | 11.40% |
| ROA (Latest) ⓘ | 1.53% | 6.06% |
| ROIC (5Y Median) ⓘ | 5.75% | 10.30% |
| ROA (5Y Median) ⓘ | -0.14% | 5.42% |
| Net Debt / EBIT (Latest) ⓘ | 7.85 | 1.64 |
| Net Debt / EBIT (5Y Median) ⓘ | 12.50 | 1.83 |
| Net Debt / EBITDA (Latest) ⓘ | 4.90 | 1.08 |
| Net Debt / Assets ⓘ | 58.37% | 17.29% |
| EBITDA / Interest ⓘ | 2.40 | 9.64 |
| Operating Margin (Latest) ⓘ | 21.94% | 16.27% |
| Operating Margin (5Y Median) ⓘ | 9.86% | 20.39% |
| Debt to Equity (Latest) ⓘ | -951.15% | 54.76% |
| Profit Margin (Latest) ⓘ | 4.30% | 8.82% |
| Free Cash Flow (Latest) ⓘ | $344.68M | |
Momentum (Price trend) | ||
| 3Y Return ⓘ | +54.35% | +67.38% |
| 12M Return (excl. last month) ⓘ | -2.46% | +49.19% |
| 6M Return ⓘ | -15.08% | +7.07% |
| Price vs. 200-Day MA ⓘ | -10.09% | +9.56% |
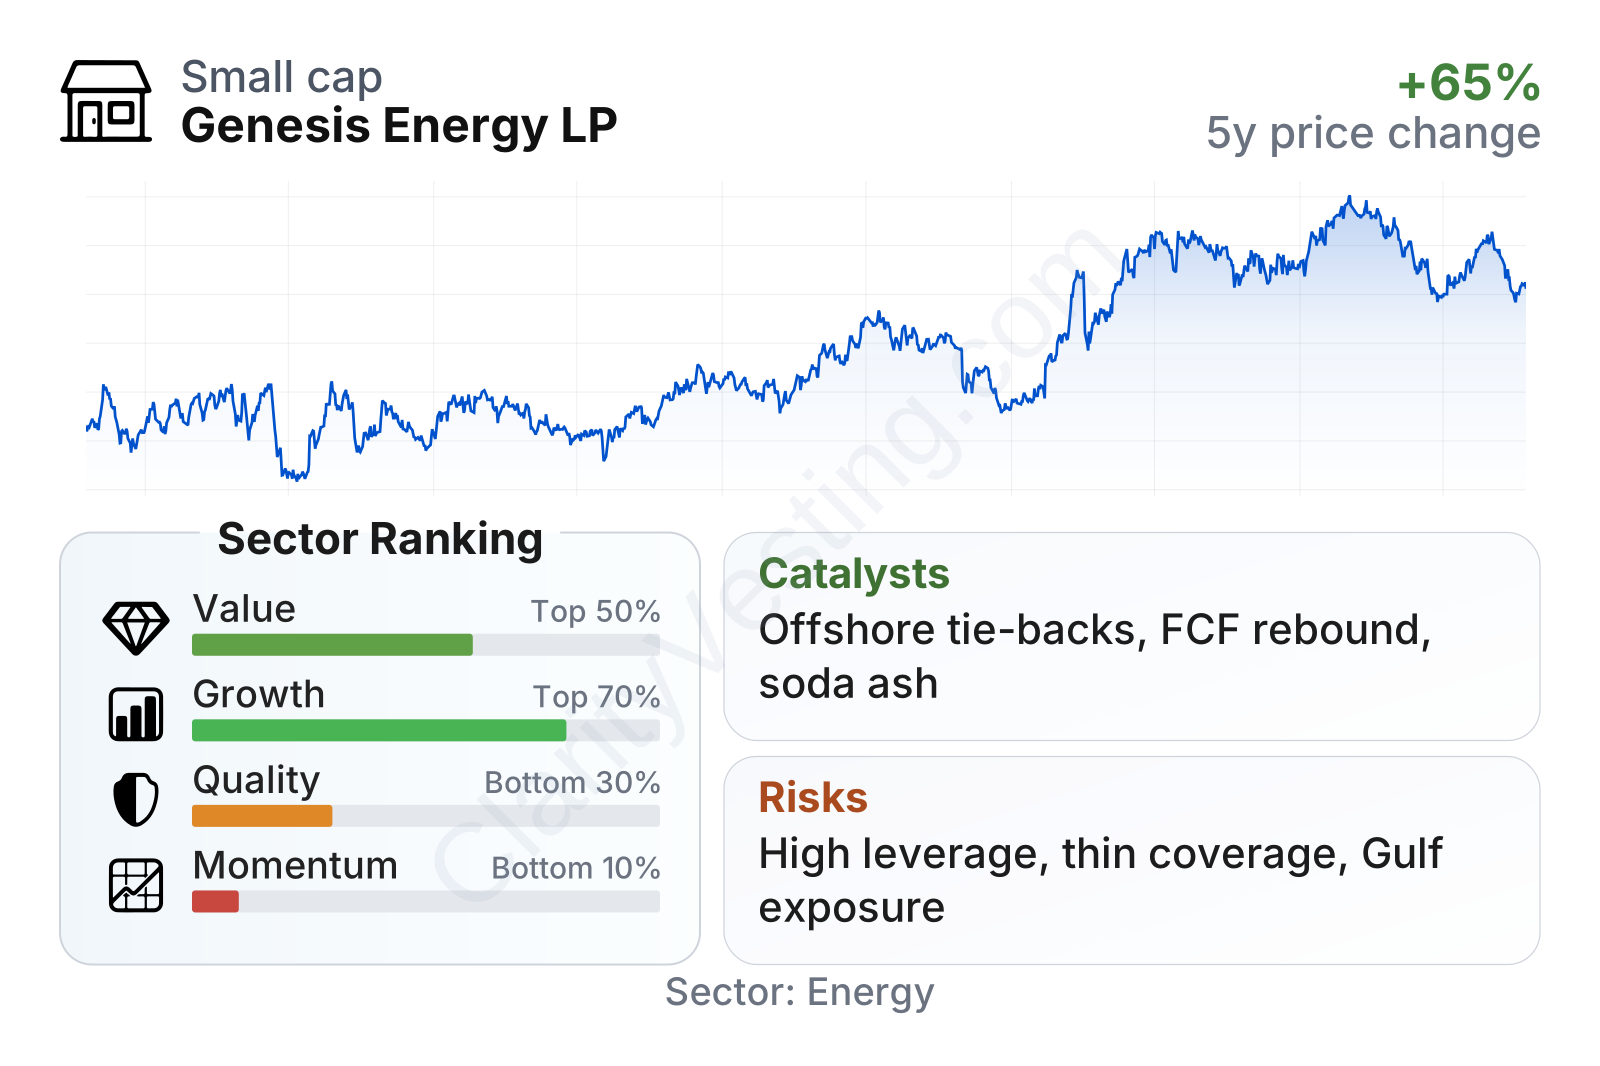
Genesis is a small-cap midstream company with a lower-than-market beta, but the underlying picture is mixed. On value metrics tied to cash flow, it screens better than much of the energy sector: free cash flow yield is well above the sector median, dividend yield is also above average, and EBIT relative to enterprise value is roughly in line with peers. At the same time, the headline P/E is very high, which usually signals that accounting earnings remain thin relative to the stock price.
The broader factor profile explains why the stock can look cheap and expensive at the same time. Growth rankings are below the sector’s stronger names, quality ranks weak because leverage is high and interest coverage is limited, and price momentum has been poor recently after a stronger multiyear recovery. In other words, Genesis currently looks more like a cash-generation and balance-sheet repair case than a clean high-quality compounder.
Growth
Genesis operates in parts of the energy infrastructure market that should remain relevant for years, especially offshore transportation, export-linked logistics, and soda ash. The sector is not a fast-growing technology market, but it can still grow through rising production volumes, new tie-backs to existing systems, better utilization of installed assets, and disciplined capital spending. For Genesis specifically, the most important point is that much of its network serves hard-to-replicate locations, particularly offshore Gulf production corridors.
The company’s strategy for future growth is centered on maximizing existing infrastructure, connecting new offshore developments, and continuing to benefit from its soda ash platform. Offshore fields often require long lead times and major capital commitments from producers, so once projects move into production, connected midstream systems can enjoy durable throughput. This gives Genesis exposure to long-duration assets rather than short-cycle drilling alone.
Recent revenue growth has been volatile, which is normal for a company with some commodity-sensitive and marketing-linked activities. After a deep contraction through much of 2024 and 2025, the latest year-over-year trend turned positive again and recently accelerated to around 40%, stronger than the sector median. That rebound is encouraging, but the longer five-year picture remains uneven, so the latest improvement matters more as a sign of recovery than as proof of a stable growth trend.
Free cash flow is one of the more important recent changes. Genesis moved from negative trailing free cash flow in prior periods to clearly positive territory in 2026. For a leveraged midstream company, that shift is significant because excess cash can support debt reduction, capital discipline, and a more durable distribution profile. It also suggests that major spending pressure may be easing relative to cash generated by the asset base.
A meaningful catalyst is the continued development of deepwater Gulf production tied to Genesis’s offshore systems. New wells and subsea tie-backs can add volumes without requiring the company to build an entirely new regional footprint. Another catalyst is soda ash demand, where global glass and industrial consumption can support volumes and pricing if export conditions remain favorable. Recent company communications have also emphasized deleveraging and improving coverage, which could strengthen the equity case if execution continues.
Risks
This article is for informational purposes only and does not constitute financial advice. Some content is AI-generated. See Disclaimer


