Stock Analysis · GE Aerospace (GE)
Overview
GE Aerospace is a large U.S. aerospace company focused mainly on aircraft propulsion and related services. After the breakup of the old General Electric conglomerate, the company became much more specialized. Today, its core business is designing, manufacturing, and servicing jet engines for commercial airlines, cargo operators, business aviation, and military customers. It also sells aircraft engine components, spare parts, and digital and maintenance solutions tied to those engines.
This narrower structure matters for long-term analysis because GE Aerospace is now much easier to understand than the former multi-industry GE. The company’s economics are driven by two main engines: selling aircraft equipment and then earning recurring revenue for decades from maintenance, repair, and overhaul as those engines stay in service.
Based on the company’s recent annual reporting, revenue is concentrated in two major segments:
- Commercial Engines & Services: about 71% of revenue. This is the largest activity by far. It includes jet engines for large commercial aircraft and regional aviation, plus spare parts, maintenance, shop visits, and long-term service agreements. This segment is the financial backbone of the company.
- Defense & Propulsion Technologies: about 29% of revenue. This includes military aircraft engines, rotorcraft propulsion, and related systems and services for defense customers.
Within those segments, services are especially important. New engine deliveries bring in revenue, but the longer-term value often comes from aftermarket work, where fleets need ongoing maintenance and replacement parts over many years.
The business mix also helps explain why GE Aerospace is tied closely to global flight activity. When airline traffic rises, engines fly more hours, parts wear faster, and maintenance demand usually increases. That creates a recurring revenue stream that can be more durable than one-time equipment sales.
Over the last few years, the company has also become more profitable as it simplified its portfolio and focused on aerospace. Revenue has risen meaningfully since the post-pandemic recovery, while operating costs have become a smaller share of sales. Interest expense has also trended lower, which supports earnings quality.
The long-term pattern is less about diversification and more about concentration in a strong aerospace franchise: higher sales, better margins, and a business model increasingly centered on installed engines and service revenue.
Key Figures
| Metric | Value | Sector ⓘ |
|---|---|---|
| Date | Oct 31, 2026 | |
| Context | ||
| Sector | Industrials | |
| Industry | Aerospace & Defense | |
| Market Cap ⓘ | $308.84B | |
| Beta ⓘ | 1.37 | |
Value (Cheapness) | ||
| P/E Ratio ⓘ | 34.02 | 21.91 |
| P/B Ratio ⓘ | 18.13 | 1.97 |
| FCF Yield ⓘ | 2.58% | 6.34% |
| Dividend Yield ⓘ | 0.61% | 1.88% |
| EBIT / EV ⓘ | 3.74% | 4.83% |
| PEG ⓘ | 3.42 | |
Growth (Business expansion) | ||
| Revenue Growth ⓘ | 15.90% | 9.50% |
| RPS Growth (5Y CAGR) ⓘ | -4.39% | 7.67% |
| EPS Growth (5Y CAGR) ⓘ | 25.58% | -11.63% |
| BVPS Growth (5Y CAGR) ⓘ | -17.15% | 6.14% |
| Margin Growth (5Y Trend) ⓘ | 30.56% | 0.71% |
| FCF Growth (5Y CAGR) ⓘ | 38.56% | 11.01% |
| DPS Growth (5Y CAGR) ⓘ | 26.97% | 9.31% |
Quality (Business durability) | ||
| ROIC (Latest) ⓘ | 26.53% | 10.70% |
| ROA (Latest) ⓘ | 7.07% | 5.45% |
| ROIC (5Y Median) ⓘ | 17.29% | 9.33% |
| ROA (5Y Median) ⓘ | 4.34% | 4.94% |
| Net Debt / EBIT (Latest) ⓘ | 0.91 | 2.03 |
| Net Debt / EBIT (5Y Median) ⓘ | 0.77 | 2.28 |
| Net Debt / EBITDA (Latest) ⓘ | 0.84 | 1.37 |
| Net Debt / Assets ⓘ | 8.30% | 19.16% |
| EBITDA / Interest ⓘ | 13.54 | 9.73 |
| Operating Margin (Latest) ⓘ | 22.03% | 10.49% |
| Operating Margin (5Y Median) ⓘ | 22.24% | 10.30% |
| Debt to Equity (Latest) ⓘ | 110.29% | 65.91% |
| Profit Margin (Latest) ⓘ | 17.31% | 6.61% |
| Free Cash Flow (Latest) ⓘ | $7.96B | |
Momentum (Price trend) | ||
| 3Y Return ⓘ | +260.91% | +69.18% |
| 12M Return (excl. last month) ⓘ | +8.43% | +12.04% |
| 6M Return ⓘ | +4.41% | +0.22% |
| Price vs. 200-Day MA ⓘ | -6.51% | +0.19% |
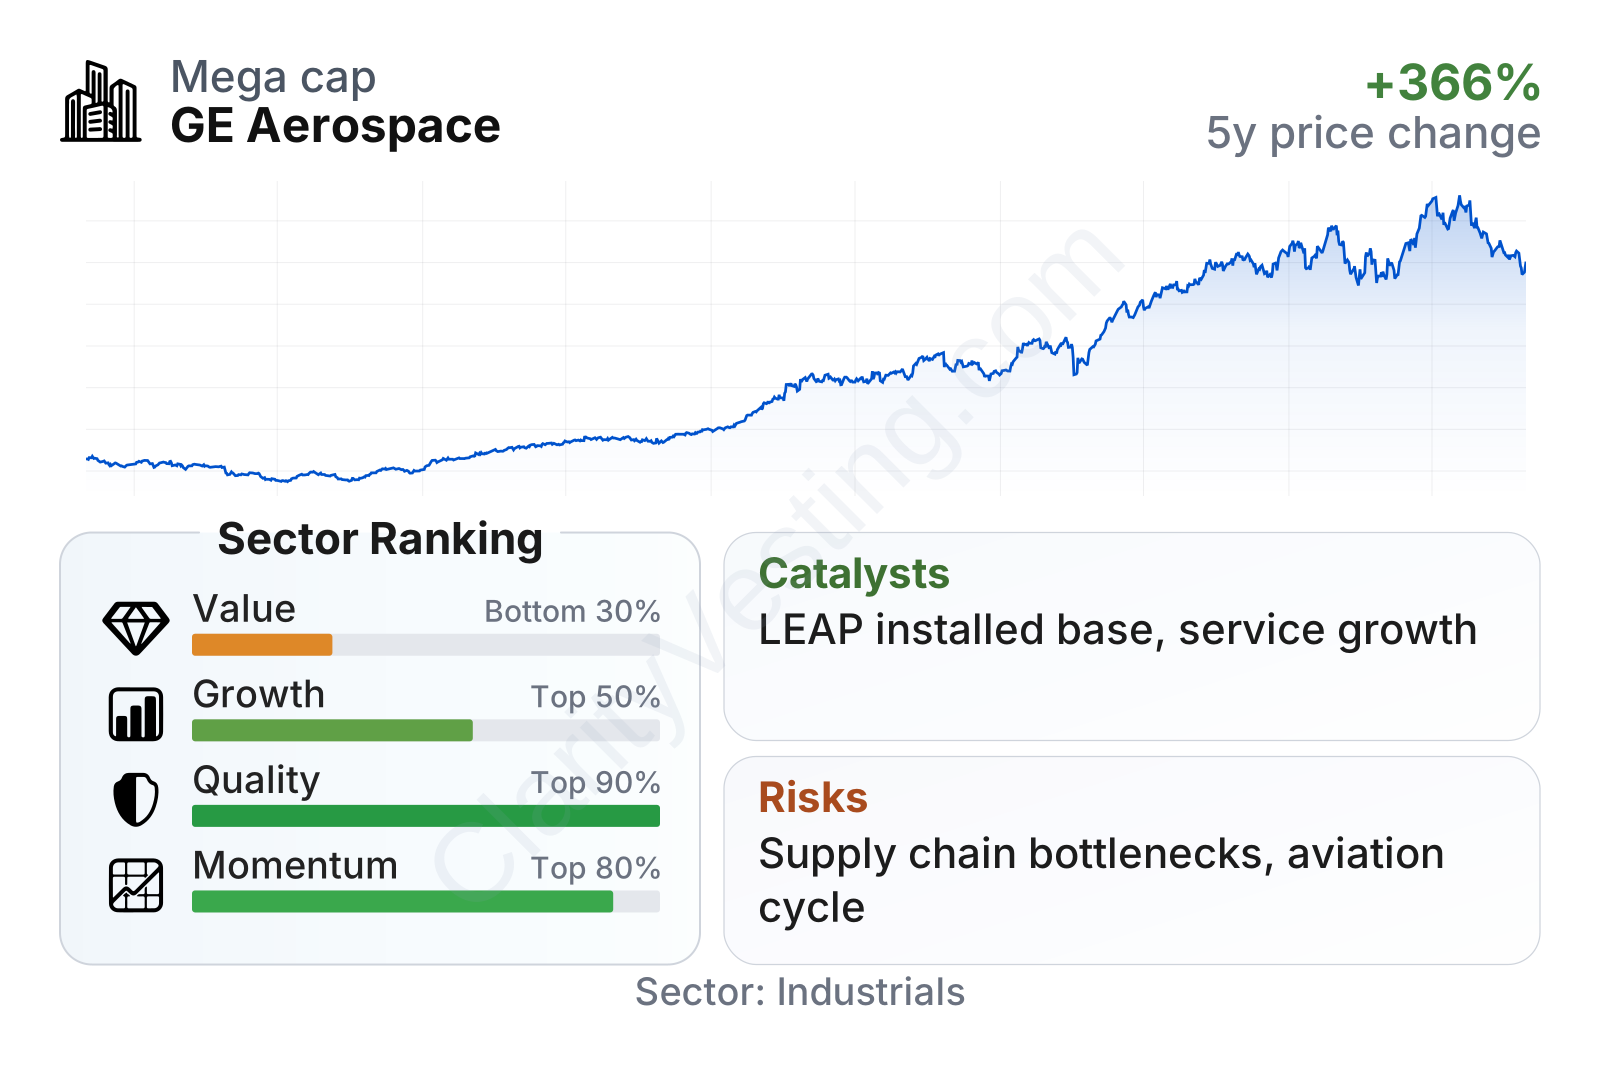
GE Aerospace stands out for quality more than cheapness. Profitability and returns on capital rank near the top of its sector, supported by operating margins around the low-20% range and profit margins in the high-teens, both clearly above sector norms. Growth is also solid, with recent revenue expansion ahead of the industry median and free cash flow improving strongly over time. The weaker area is valuation: the stock trades at higher multiples than the sector, while dividend yield and free cash flow yield remain comparatively low. In short, the market is placing a premium on execution, margins, and aerospace exposure.
The stock chart also shows how strongly market expectations have shifted. Shares have risen several-fold from 2022 lows, reflecting both the aerospace recovery and confidence in the company’s post-separation business model.
Growth
GE Aerospace operates in a sector with favorable long-term drivers. Global air travel has historically grown over time, supported by rising passenger volumes, fleet renewal, and demand for more fuel-efficient aircraft. Airlines are also under pressure to improve fuel burn and operating economics, which supports demand for newer engines and ongoing upgrades. Defense demand adds a second growth layer, with military propulsion programs offering a steadier counterbalance to the commercial cycle.
The company’s strategy fits these trends well. It is focusing capital and management attention on aerospace alone, rather than spreading resources across unrelated industries. That sharper focus can improve execution in product development, manufacturing, and service capacity. For a business built on long-life installed equipment, execution in services may be just as important as winning new engine orders.
Recent revenue growth has been strong by sector standards, with year-over-year expansion running in the mid-teens lately after a period distorted by restructuring and portfolio changes. The broader point is that the current company is showing a more consistent upward sales trend, helped by commercial aviation demand and a large installed base that keeps feeding service activity.
Cash generation is another important growth signal. Free cash flow has climbed materially over the past few years and recently reached a much higher level than in earlier periods. That matters because aerospace accounting can sometimes look noisy, while cash flow gives a clearer view of whether deliveries, pricing, and service work are translating into real financial strength.
A major catalyst remains the large installed fleet of CFM engines, including the LEAP family produced through CFM International, the long-standing joint venture with Safran. As more LEAP-powered aircraft enter service, the future pool of maintenance work can expand for many years. In addition, airline fleets are aging in some regions because aircraft production constraints have delayed deliveries, which tends to keep existing aircraft flying longer and supports aftermarket demand.
Recent company communications have also emphasized strong demand in commercial services and ongoing defense opportunities. The company continues to invest in manufacturing capacity, supply chain resilience, and next-generation technologies, which suggests management is preparing for sustained demand rather than a short-lived rebound.
Risks
This article is for informational purposes only and does not constitute financial advice. Some content is AI-generated. See Disclaimer


