Stock Analysis · Goodrx Holdings Inc (GDRX)
Overview
GoodRx Holdings Inc. runs a digital platform focused on helping consumers lower the cost of healthcare, especially prescription drugs. Its best-known product is a price-comparison and discount service that lets people search medication prices at pharmacies and use GoodRx codes or coupons to access lower cash prices. The company also operates telehealth and pharmaceutical manufacturer solutions, which broaden its role from simple price discovery into a wider consumer healthcare marketplace.
GoodRx’s business is mostly built around consumer transactions and healthcare-related advertising or service fees. Based on the company’s recent annual reporting structure, revenue comes from three main sources:
- Prescription Transactions Revenue — about 79%: revenue tied to prescription-related activity on the platform, including fees generated when consumers use GoodRx discounts at pharmacies.
- Pharma Manufacturer Solutions — about 13%: advertising, sponsored content, and other programs sold to pharmaceutical manufacturers that want to reach patients and healthcare professionals.
- Subscriptions and Other Revenue — about 8%: membership fees from paid offerings such as GoodRx Gold and other smaller services, including healthcare-related offerings beyond the core prescription marketplace.
This mix shows that GoodRx is still primarily a prescription savings platform, even though management has spent time expanding into broader healthcare services. The business model is asset-light: it does not manufacture drugs or operate pharmacies at scale, but instead earns fees by connecting consumers, pharmacy benefit managers, pharmacies, and healthcare advertisers. That structure helps keep gross margins high, but it also means the company depends heavily on traffic, partner relationships, and continued consumer engagement.
Over the last several years, revenue has been fairly stable in the high hundreds of millions of dollars, while operating profitability has improved noticeably. Cost of revenue remains relatively low compared with total sales, and a larger share of each dollar of revenue now falls through to operating income than in the weaker period of 2022 and 2023. Research and development plus selling and administrative costs are still meaningful, but expense discipline has become more visible.
The financial flow highlights a business with very high gross profit, improving operating income, and a much better bottom line than a few years ago. The main change has not been explosive revenue expansion, but better efficiency and tighter control of operating costs.
Key Figures
| Metric | Value | Sector ⓘ |
|---|---|---|
| Date | Oct 17, 2026 | |
| Context | ||
| Sector | Healthcare | |
| Industry | Health Information Services | |
| Market Cap ⓘ | $1.15B | |
| Beta ⓘ | 1.69 | |
Value (Cheapness) | ||
| P/E Ratio ⓘ | 67.60 | 24.79 |
| P/B Ratio ⓘ | 1.88 | 3.08 |
| FCF Yield ⓘ | 12.64% | 3.15% |
| Dividend Yield ⓘ | N/A | 1.94% |
| EBIT / EV ⓘ | 5.98% | 0.57% |
| PEG ⓘ | N/A | |
Growth (Business expansion) | ||
| Revenue Growth ⓘ | -1.30% | 7.45% |
| RPS Growth (5Y CAGR) ⓘ | 5.26% | 8.61% |
| EPS Growth (5Y CAGR) ⓘ | -23.48% | -17.81% |
| BVPS Growth (5Y CAGR) ⓘ | -3.95% | 3.72% |
| Margin Growth (5Y Trend) ⓘ | 10.64% | -0.62% |
| FCF Growth (5Y CAGR) ⓘ | 3.31% | 1.04% |
| DPS Growth (5Y CAGR) ⓘ | -98.54% | 6.77% |
Quality (Business durability) | ||
| ROIC (Latest) ⓘ | 2.67% | 3.24% |
| ROA (Latest) ⓘ | 0.89% | 3.01% |
| ROIC (5Y Median) ⓘ | 0.73% | 4.60% |
| ROA (5Y Median) ⓘ | -0.56% | 1.89% |
| Net Debt / EBIT (Latest) ⓘ | 2.95 | 1.34 |
| Net Debt / EBIT (5Y Median) ⓘ | 1.13 | 1.84 |
| Net Debt / EBITDA (Latest) ⓘ | 1.42 | 1.00 |
| Net Debt / Assets ⓘ | 10.36% | 5.45% |
| EBITDA / Interest ⓘ | 4.19 | 9.64 |
| Operating Margin (Latest) ⓘ | 10.47% | 9.27% |
| Operating Margin (5Y Median) ⓘ | 1.81% | 7.38% |
| Debt to Equity (Latest) ⓘ | 83.22% | 28.58% |
| Profit Margin (Latest) ⓘ | 2.07% | 3.59% |
| Free Cash Flow (Latest) ⓘ | $145.75M | |
Momentum (Price trend) | ||
| 3Y Return ⓘ | -36.62% | +42.80% |
| 12M Return (excl. last month) ⓘ | -14.46% | +18.50% |
| 6M Return ⓘ | +51.08% | +7.57% |
| Price vs. 200-Day MA ⓘ | +26.03% | +5.12% |
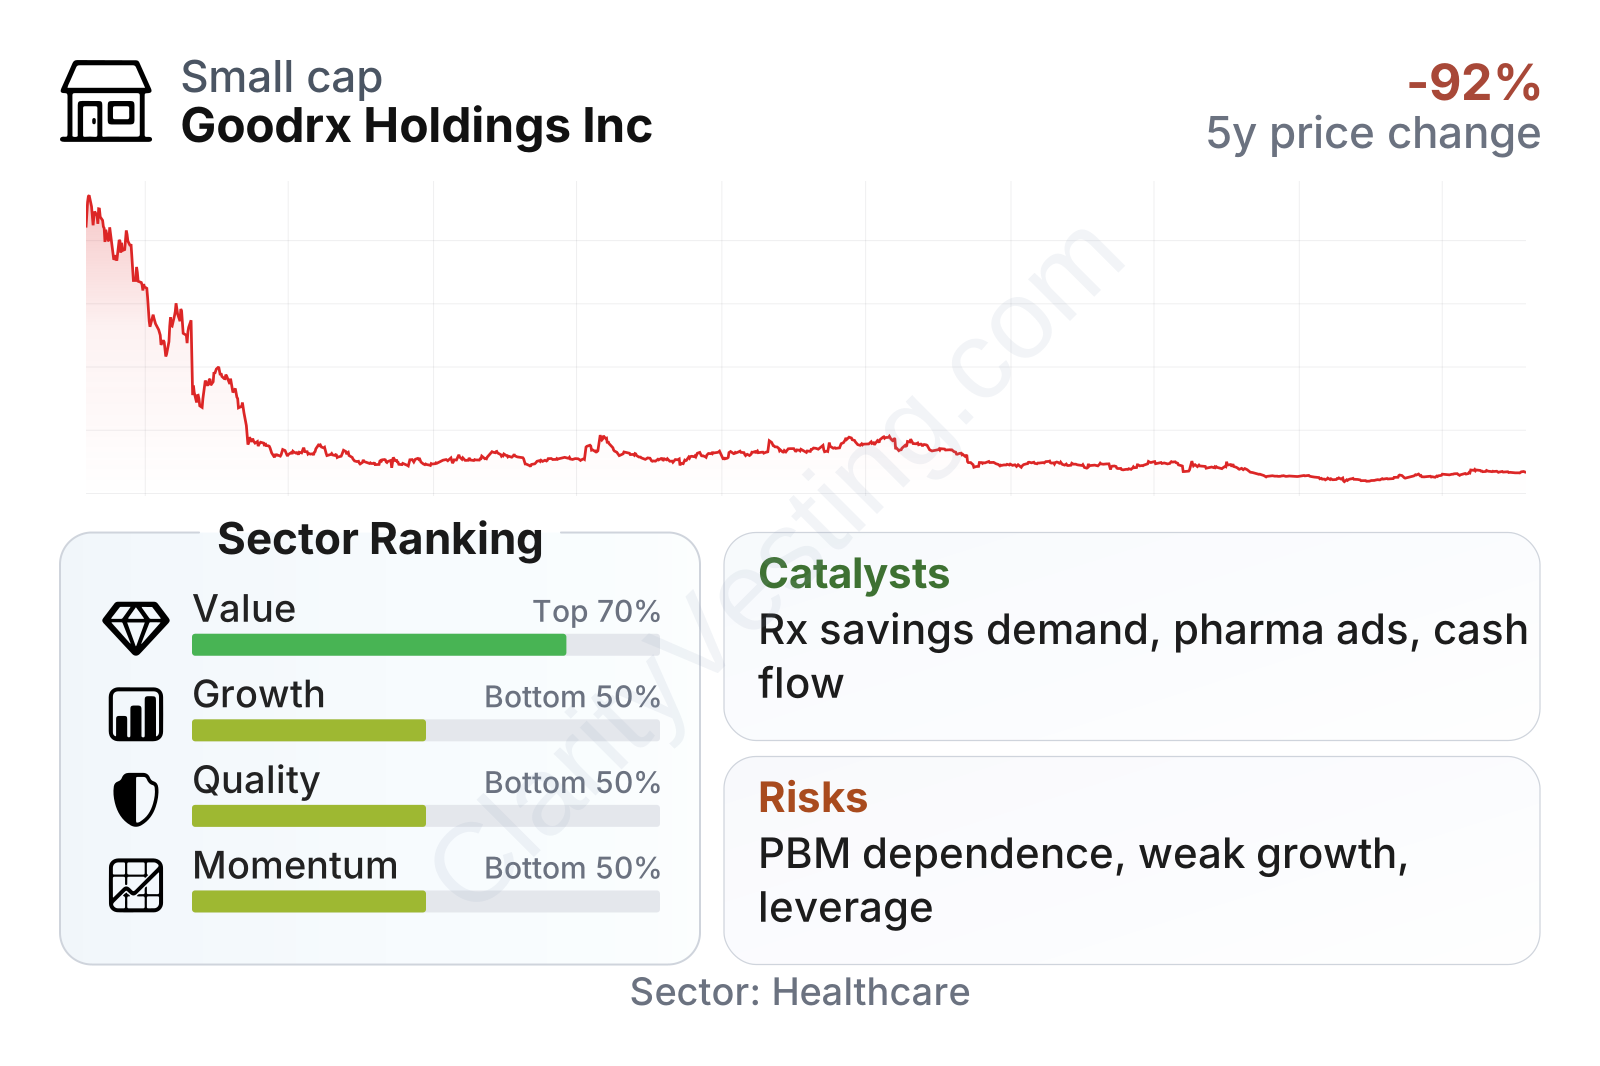
GoodRx is now a relatively small public healthcare technology company by market value, and its share price history has been extremely volatile since 2021. The stock remains far below its early post-IPO levels, although there has been a rebound from the 2026 low. In the latest factor snapshot, valuation metrics look mixed: the earnings multiple is well above the healthcare sector median, but cash-flow-based measures are much stronger than typical peers. Growth and quality rank in the lower half of the sector, while recent momentum has improved after a long period of weak stock performance.
Growth
GoodRx operates in a large and structurally relevant part of healthcare: prescription affordability, consumer price transparency, digital engagement, and lower-cost access points such as telehealth. Those themes are supported by long-term pressure on U.S. healthcare costs. Consumers continue to look for lower out-of-pocket spending, and that creates a durable reason for a service like GoodRx to exist.
That said, the company’s recent growth profile has been modest rather than strong. Annual revenue rose from about $745 million in 2021 to roughly $797 million in 2025, which shows expansion over time, but not at the pace usually associated with high-growth digital health businesses. Quarterly year-over-year revenue growth was positive through much of 2024 and parts of 2025, then turned slightly negative again in late 2025 and the first half of 2026. This points to a business that has regained some stability, but has not yet established a powerful and consistent growth trend.
Management’s strategy still makes sense in principle. GoodRx already has consumer brand recognition in prescription savings, and that can be used to support adjacent services such as subscription offerings, manufacturer solutions, and care navigation. The company has also emphasized deeper integrations, including work with pharmacy and healthcare partners, which could improve user convenience and help conversion. If GoodRx can increase the number of consumers who use multiple services rather than a single coupon transaction, revenue per user could improve without requiring dramatic user growth.
Another positive point is cash generation. Even while revenue growth has been uneven, GoodRx has continued to produce positive free cash flow, which gives it room to invest in products, partnerships, and debt management without relying heavily on new outside capital.
Free cash flow has remained positive and fairly resilient, even after the company’s more difficult operating period. That matters because it suggests the core platform still converts revenue into real cash, even when top-line growth is soft.
A meaningful catalyst is the ongoing need for prescription price transparency in the U.S. market. GoodRx is positioned where consumer frustration, pharmacy pricing complexity, and digital healthcare adoption meet. If the company can keep improving platform engagement, restore steadier prescription transaction growth, and expand higher-value relationships with pharmaceutical manufacturers, the business could look more diversified and less dependent on a single activity. Recent company communications have also continued to frame artificial intelligence and product improvements as ways to make the platform easier to use and more effective, which could support engagement over time.
Risks
This article is for informational purposes only and does not constitute financial advice. Some content is AI-generated. See Disclaimer


