Stock Analysis · General American Investors Closed Fund (GAM)
Overview
General American Investors Company, known by the ticker GAM, is a closed-end investment company. In simple terms, it is a publicly traded fund that owns a portfolio of stocks and other securities rather than operating factories, stores, or software platforms. Its goal is long-term capital appreciation, which means increasing the value of its portfolio over time. The company has been around for decades and is managed internally, which is somewhat unusual in the fund industry because many listed funds hire outside managers.
The portfolio is broadly invested in publicly traded companies, with a strong focus on U.S. equities. Based on recent annual reporting, the largest sector exposures have included information technology, financials, health care, communication services, and industrials, although the mix changes with market conditions and management decisions. GAM also uses a structure that includes a common stock portfolio and a preferred stock series outstanding, which affects how returns are distributed between common shareholders and preferred holders.
Unlike a traditional operating business, GAM does not generate revenue by selling products or subscriptions. Its economic results come mainly from investment income and changes in the value of the securities it owns. That means earnings can swing sharply from year to year depending on the stock market.
The main economic sources behind results are typically:
- Net realized and unrealized gains on investments: usually the largest driver in strong market years, coming from the appreciation of portfolio holdings and gains when securities are sold.
- Dividend income from portfolio companies: cash distributions received from stocks held in the portfolio.
- Interest and other investment income: a smaller contribution, linked to cash balances, short-term investments, or other securities.
For a fund like GAM, exact percentages can vary widely from one year to another because market gains or losses can dominate total income. Recent results show just how variable this can be: after a loss year in 2022, profitability rebounded strongly in 2023, remained robust in 2024, and stayed elevated in 2025. Expenses have remained relatively small compared with the swings in portfolio value, which is a positive trait for a long-term investment vehicle.
The financial flow shows a business model with low operating costs relative to assets, but highly market-sensitive results. The key pattern is not steady sales growth, but large changes in net income driven by the portfolio’s performance from year to year.
Key Figures
| Metric | Value | Sector ⓘ |
|---|---|---|
| Date | Oct 24, 2026 | |
| Context | ||
| Sector | Financial Services | |
| Industry | Asset Management | |
| Market Cap ⓘ | $1.55B | |
| Beta ⓘ | 0.82 | |
Value (Cheapness) | ||
| P/E Ratio ⓘ | 4.08 | 12.46 |
| P/B Ratio ⓘ | 0.80 | 1.25 |
| FCF Yield ⓘ | N/A | 9.82% |
| Dividend Yield ⓘ | 9.87% | 2.94% |
| EBIT / EV ⓘ | N/A | 8.11% |
| PEG ⓘ | N/A | |
Growth (Business expansion) | ||
| Revenue Growth ⓘ | 0.90% | 9.10% |
| RPS Growth (5Y CAGR) ⓘ | -13.65% | 12.31% |
| EPS Growth (5Y CAGR) ⓘ | 16.64% | -6.97% |
| BVPS Growth (5Y CAGR) ⓘ | 5.69% | 5.02% |
| Margin Growth (5Y Trend) ⓘ | 112.17% | -4.00% |
| FCF Growth (5Y CAGR) ⓘ | N/A | 4.71% |
| DPS Growth (5Y CAGR) ⓘ | N/A | 8.92% |
Quality (Business durability) | ||
| ROIC (Latest) ⓘ | N/A | 9.18% |
| ROE (Latest) ⓘ | 20.46% | 13.93% |
| ROA (Latest) ⓘ | 20.20% | 1.57% |
| ROIC (5Y Median) ⓘ | N/A | 7.80% |
| ROE (5Y Median) ⓘ | 20.52% | 12.15% |
| ROA (5Y Median) ⓘ | 20.28% | 1.28% |
| Net Debt / EBIT (Latest) ⓘ | N/A | 1.02 |
| Net Debt / EBIT (5Y Median) ⓘ | 0.01 | 0.72 |
| Net Debt / EBITDA (Latest) ⓘ | N/A | 0.88 |
| Operating Margin (Latest) ⓘ | N/A | 22.30% |
| Operating Margin (5Y Median) ⓘ | 107.64% | 24.50% |
| Debt to Equity (Latest) ⓘ | 0.08% | 59.34% |
| Profit Margin (Latest) ⓘ | 1542.35% | 26.42% |
| Free Cash Flow (Latest) ⓘ | N/A | |
Momentum (Price trend) | ||
| 3Y Return ⓘ | +104.91% | +95.73% |
| 12M Return (excl. last month) ⓘ | +17.68% | +17.30% |
| 6M Return ⓘ | -1.34% | +6.07% |
| Price vs. 200-Day MA ⓘ | +1.49% | +5.36% |
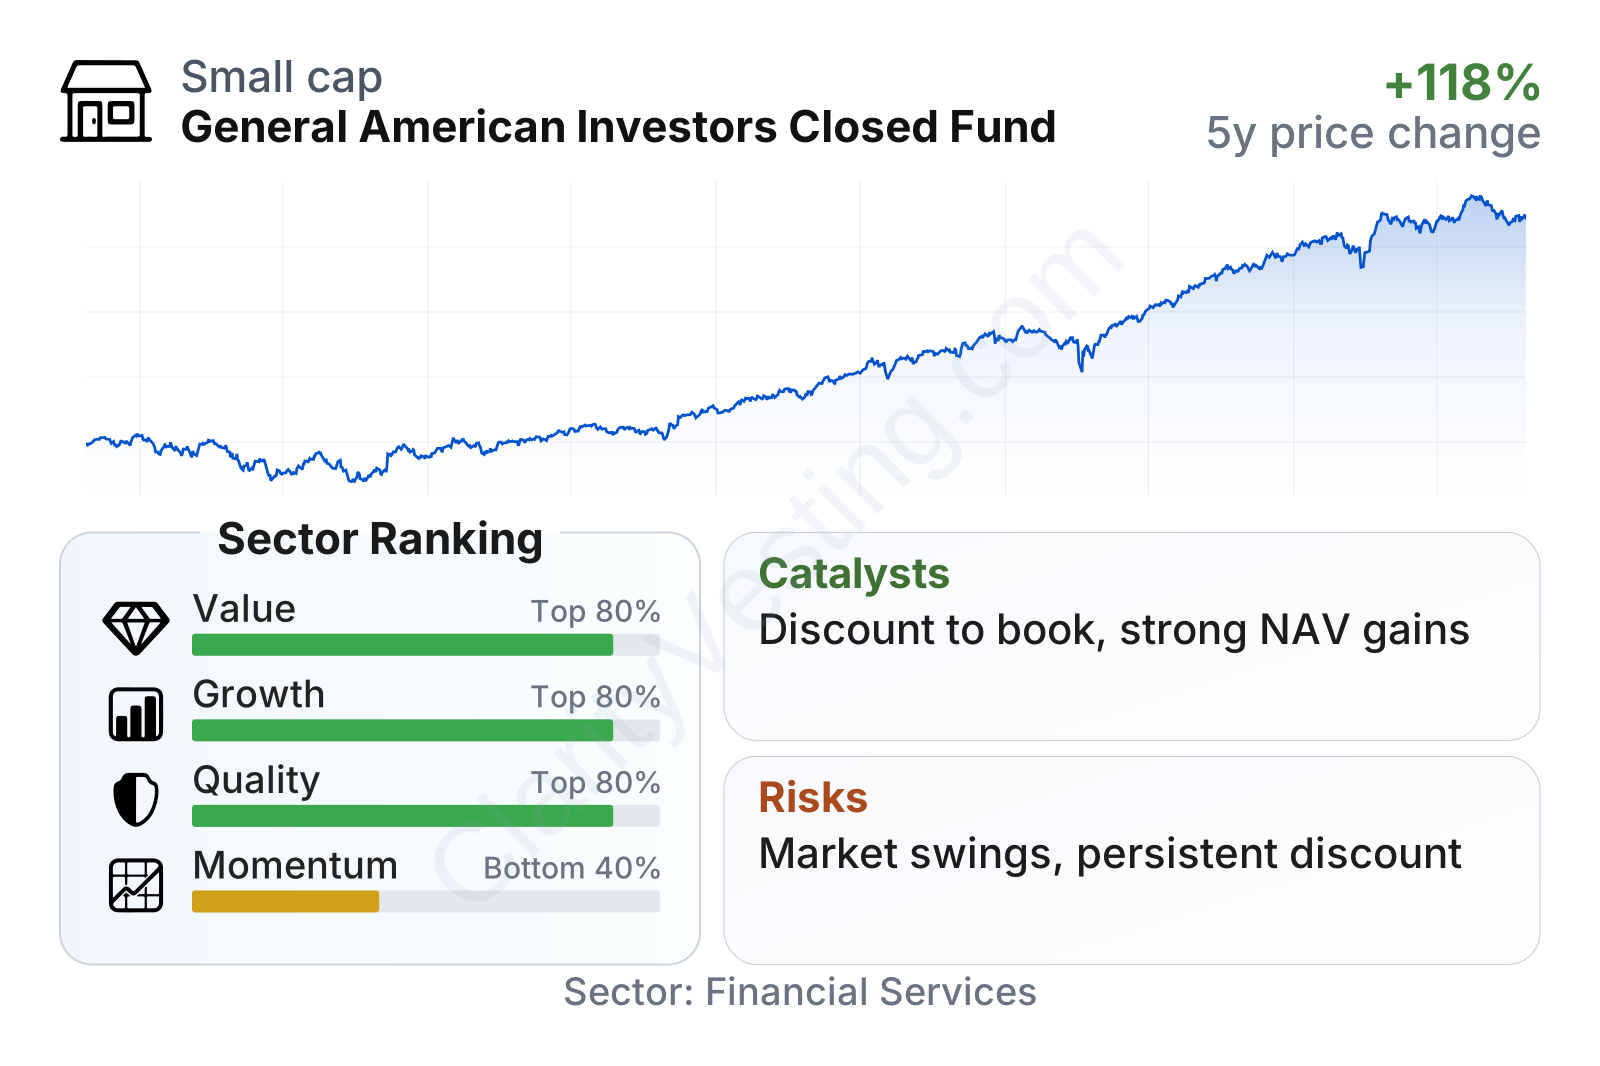
GAM is a mid-sized listed fund with a market value around $1.5 billion and a beta below 1, which suggests its share price has tended to move somewhat less aggressively than the broader market. On valuation metrics, it screens cheaply versus much of the financial services sector, with a price-to-book ratio below the sector median and a very high trailing dividend yield, helped by its policy of making larger year-end distributions when gains allow. Quality measures stand out: return on equity is around 20% and return on assets is also unusually high for the sector, while leverage is close to zero. Growth readings are more mixed because this is not an operating company with predictable revenue expansion; earnings and book value matter more than sales-like figures here.
The stock chart shows a powerful multi-year climb from 2022 lows through 2026, although that rise has not been perfectly smooth. That matters for a closed-end fund because strong price performance can still coexist with a discount to net asset value, and that discount often becomes one of the most important valuation questions.
Growth
GAM operates in asset management, but it is best understood as a long-lived equity portfolio rather than a fee-driven money manager. The long-term growth case depends less on industry expansion and more on three things: the direction of equity markets, the manager’s security selection, and the company’s ability to compound net asset value over time while keeping costs contained.
That strategy is sensible for a closed-end fund with permanent capital. Because it does not have to meet daily redemptions like an open-end mutual fund, management can stay invested through market downturns and hold positions for many years. This structure can support patient investing, especially when the portfolio is concentrated in businesses expected to grow over time.
Earnings per share have recently moved higher, reflecting favorable market conditions and portfolio gains. For GAM, EPS should be read carefully: it can rise quickly in bull markets and reverse in weak markets. Even so, the recent direction supports the view that the underlying holdings have been performing well.
Book value per share is one of the most important indicators for a fund like this because it approximates the net asset value available to common shareholders. The path has been volatile, dropping in difficult markets and then rebounding sharply. Over five years, book value per share has still grown at a mid-single-digit annual rate, roughly in line with or slightly ahead of the sector median, which suggests value creation has continued despite large market swings.
A notable catalyst is the gap between market price and book value. Closed-end funds often trade at discounts or premiums to the value of their portfolios. When a fund with a long history, low leverage, and strong portfolio performance still trades below book value, any narrowing of that discount can support shareholder returns even without extraordinary underlying portfolio gains. Another support factor is GAM’s long record of distributions, including sizeable capital gain distributions in stronger years, which can keep attention on the shares.
Recent company updates have also pointed to continued portfolio activity and ongoing capital management within a structure that has remained stable. There is no obvious transformational corporate event driving the case; the more important opportunity is steady net asset value compounding combined with the possibility of discount normalization.
Risks
This article is for informational purposes only and does not constitute financial advice. Some content is AI-generated. See Disclaimer


