Stock Analysis · Faurecia S.E (FURCF)
Overview
Faurecia S.E., now operating within the FORVIA group after the combination with Hella, is a global automotive supplier. The company designs and manufactures parts and systems used by carmakers, with activities spanning vehicle interiors, seating, electronics, lighting, clean mobility technologies, and lifecycle solutions. Its customers are mainly major global automakers, which means its business is tied closely to vehicle production volumes, model launches, and the shift toward electric and software-enabled vehicles.
Revenue is diversified across several product families. Based on the group structure and recent company reporting, the main sources of revenue are approximately:
- Seating: about 30% of revenue. This includes complete seats, seat frames, foam, covers, and related components.
- Interiors: about 25% of revenue. This activity includes dashboards, door panels, center consoles, and cabin modules.
- Electronics: about 20% of revenue. This covers driver assistance electronics, display systems, sensors, cockpit electronics, and software-related content.
- Lighting: about 15% of revenue. This includes headlamps, rear lamps, and exterior lighting systems, largely linked to the Hella perimeter.
- Clean Mobility and Lifecycle Solutions: about 10% of revenue combined. These activities include emissions-control systems, hydrogen-related solutions, and aftermarket or service-oriented operations.
Geographically, Faurecia is also broad-based, with Europe still important but with meaningful exposure to Asia and the Americas. That matters because automakers increasingly want suppliers that can support vehicle platforms globally rather than in just one region.
From a business-model perspective, Faurecia is a large-scale industrial supplier with high revenue but structurally thin margins. The company converts a very large cost base into relatively modest operating profit, which is common in auto parts but leaves less room for execution mistakes. Over the last several years, revenue expanded significantly after the Hella combination, but profitability has been more uneven as financing costs, restructuring, and cyclical pressure weighed on results.
The long-term pattern shows a group that became much larger in revenue terms, while net income remained volatile. Gross profit stayed substantial, but operating income and bottom-line earnings moved around much more sharply, highlighting the importance of cost discipline, integration, and debt management.
Key Figures
| Metric | Value | Sector ⓘ |
|---|---|---|
| Date | Oct 10, 2026 | |
| Context | ||
| Sector | Consumer Cyclical | |
| Industry | Auto Parts | |
| Market Cap ⓘ | $1.89B | |
| Beta ⓘ | 1.66 | |
Value (Cheapness) | ||
| P/E Ratio ⓘ | N/A | 16.86 |
| P/B Ratio ⓘ | 1.00 | 1.64 |
| FCF Yield ⓘ | 151.28% | 9.24% |
| Dividend Yield ⓘ | N/A | 2.71% |
| EBIT / EV ⓘ | N/A | 6.67% |
| PEG ⓘ | 0.11 | |
Growth (Business expansion) | ||
| Revenue Growth ⓘ | -4.30% | 5.65% |
| RPS Growth (5Y CAGR) ⓘ | 1.35% | 8.91% |
| EPS Growth (5Y CAGR) ⓘ | -32.67% | -17.54% |
| BVPS Growth (5Y CAGR) ⓘ | -56.76% | 5.62% |
| Margin Growth (5Y Trend) ⓘ | 0.25% | -0.23% |
| FCF Growth (5Y CAGR) ⓘ | 78.99% | 4.96% |
| DPS Growth (5Y CAGR) ⓘ | -10.88% | 10.03% |
Quality (Business durability) | ||
| ROIC (Latest) ⓘ | 14.36% | 12.38% |
| ROA (Latest) ⓘ | -5.75% | 5.49% |
| ROIC (5Y Median) ⓘ | 3.53% | 10.67% |
| ROA (5Y Median) ⓘ | -0.61% | 5.44% |
| Net Debt / EBIT (Latest) ⓘ | 4.14 | 2.17 |
| Net Debt / EBIT (5Y Median) ⓘ | 9.21 | 2.30 |
| Net Debt / EBITDA (Latest) ⓘ | 1.27 | 1.56 |
| Net Debt / Assets ⓘ | 20.98% | 21.76% |
| EBITDA / Interest ⓘ | 6.06 | 9.06 |
| Operating Margin (Latest) ⓘ | 3.02% | 9.08% |
| Operating Margin (5Y Median) ⓘ | 3.50% | 9.53% |
| Debt to Equity (Latest) ⓘ | 478.52% | 76.00% |
| Profit Margin (Latest) ⓘ | -8.72% | 5.31% |
| Free Cash Flow (Latest) ⓘ | $2.87B | |
Momentum (Price trend) | ||
| 3Y Return ⓘ | -47.57% | +14.94% |
| 12M Return (excl. last month) ⓘ | -22.80% | -0.67% |
| 6M Return ⓘ | -12.01% | 0.00% |
| Price vs. 200-Day MA ⓘ | -15.17% | -3.73% |
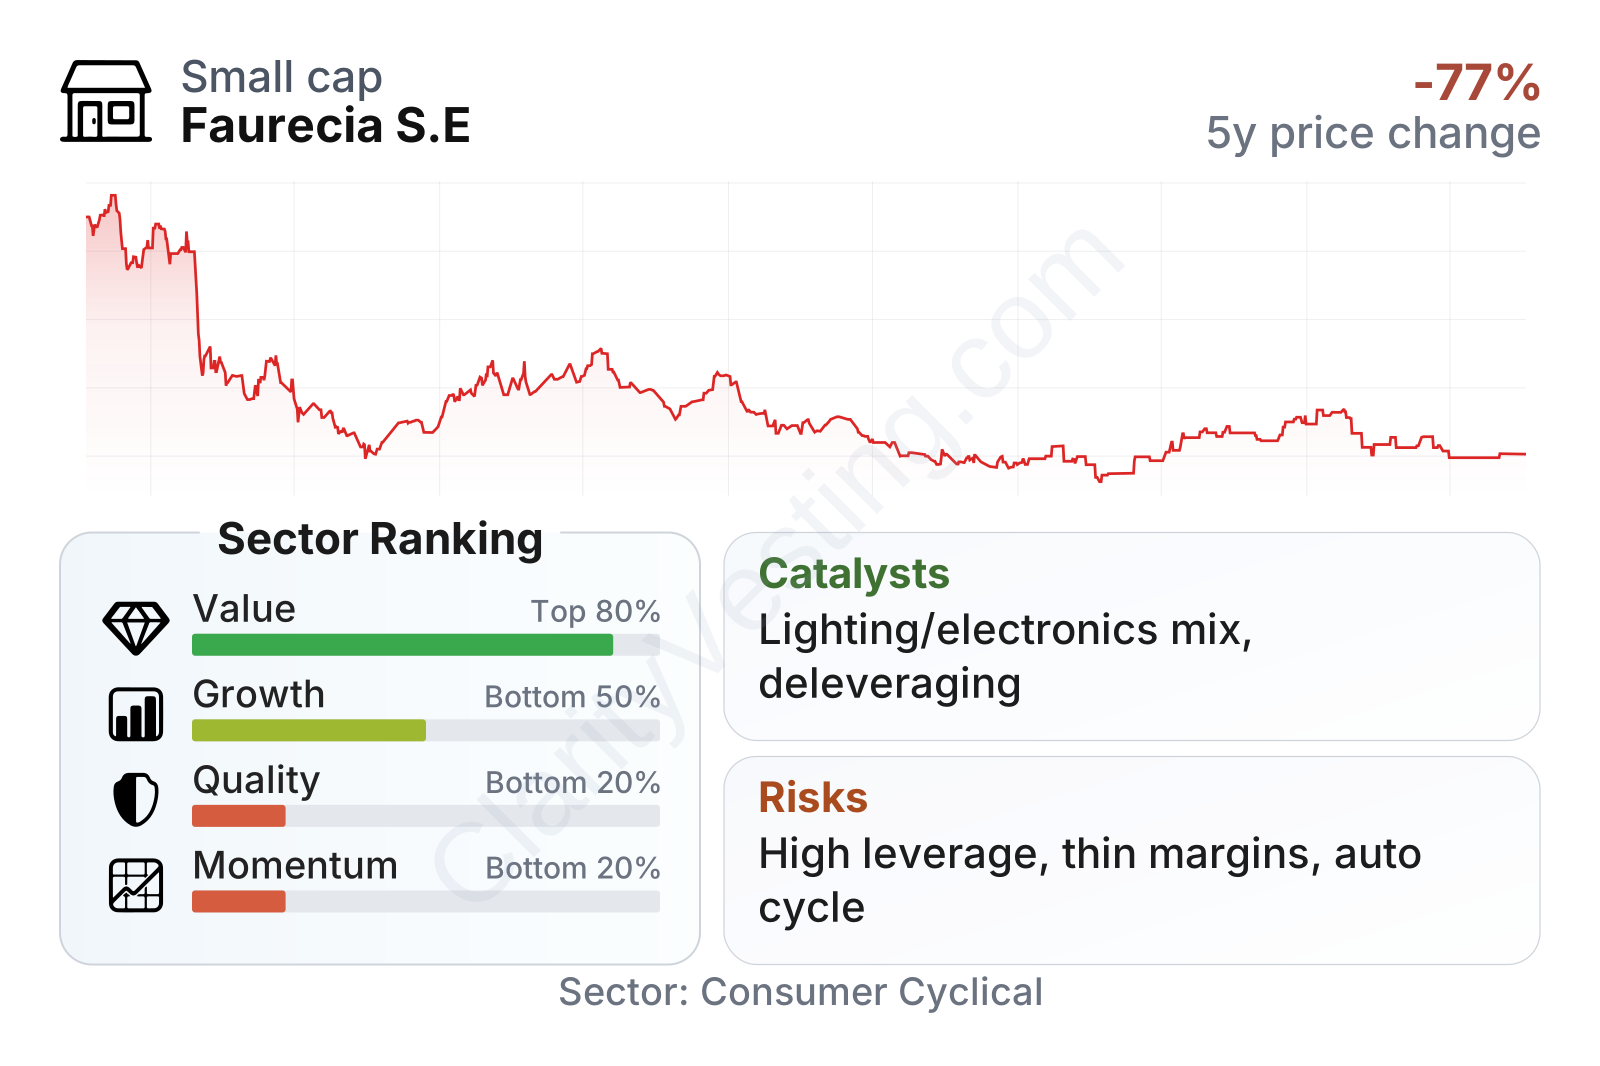
Faurecia stands out as a low-priced stock on several traditional valuation measures, with a price-to-book ratio around sector averages or lower and an unusually high free-cash-flow yield. At the same time, the broader picture is less comfortable: growth ranks in the lower part of the sector, quality ranks near the bottom, and recent share-price momentum has also lagged. In other words, the market is not treating it as a stable compounder; it is pricing in a business that looks inexpensive largely because profitability and balance-sheet confidence remain under pressure.
The stock’s historical path reflects that tension. The share price is far below 2021 levels and has struggled to rebuild a sustained uptrend. That weak long-term performance suggests investors have focused more on leverage, margin pressure, and execution risk than on the company’s scale and product breadth.
Growth
Faurecia operates in a sector that is changing quickly rather than expanding smoothly. Global vehicle production is a mature industry, but the content per vehicle is increasing in several areas that matter to the company: advanced lighting, cockpit electronics, driver-assistance systems, energy-efficiency components, and cabin features. That creates pockets of growth even when car production itself is not growing rapidly.
The strategic logic is clear. Automakers need suppliers that can help them build more digital, more efficient, and increasingly electrified vehicles. Faurecia has positioned itself around exactly those needs through electronics, lighting, smart interiors, and selected clean-mobility technologies. The Hella combination also strengthened its exposure to higher-value electronic and lighting content, which can be more attractive than traditional metal-bending or commodity parts if executed well.
Still, the recent growth profile has been mixed. Short-term revenue has contracted, and the company’s multi-year revenue-per-share growth has trailed the sector median. That does not invalidate the strategy, but it does show that the industrial logic has not yet translated into consistently stronger shareholder metrics. One positive sign is that free cash flow has improved much faster than the sector over a multi-year period, which may indicate better operating discipline and working-capital management even while accounting earnings remain noisy.
Potential catalysts for future growth include higher electronic content per vehicle, broader adoption of advanced lighting systems, and the company’s positioning in cockpit and assistance technologies. If automakers continue shifting spending toward software-linked hardware and differentiated in-car experiences, Faurecia has meaningful exposure to those trends. Another possible tailwind is any sustained improvement in European auto production and a smoother demand environment in China and North America, where large suppliers can benefit from operating leverage.
Risks
This article is for informational purposes only and does not constitute financial advice. Some content is AI-generated. See Disclaimer