Stock Analysis · Fugro N.V (FUGRF)
Overview
Fugro N.V. is a Dutch geodata specialist that helps clients understand what is happening on and below the earth’s surface. In simple terms, the company gathers and analyzes data about seabeds, soil, rocks, coastal areas, and built infrastructure. That information is used before large projects are designed, financed, built, or maintained. Fugro works across offshore energy, onshore construction, water projects, and infrastructure monitoring.
Its business sits at the intersection of engineering services, surveying, and asset monitoring. A wind farm developer may use Fugro to map the seabed before installing foundations. An oil and gas operator may hire it to inspect offshore assets. A government or rail operator may use its monitoring tools to track whether roads, bridges, tunnels, or dikes are moving over time.
Based on the company’s recent annual reporting, revenue is mainly generated from the following end markets and activities:
- Offshore energy, around 65% to 75% of revenue. This includes site characterization, geotechnical and geophysical surveys, subsea inspections, positioning, and integrity services for offshore wind as well as oil and gas.
- Infrastructure and water, around 20% to 30%. This covers land and marine site investigations, foundation studies, flood and coastal resilience work, and monitoring of transport and civil assets.
- Other activities, around 5% to 10%. This includes smaller consulting, digital, and specialized geodata assignments across adjacent markets.
Another useful way to read Fugro is by service type rather than customer industry. A large share of revenue comes from site characterization, where the company studies ground and seabed conditions; another major share comes from asset integrity and monitoring, where it helps clients inspect and manage existing structures and infrastructure. This mix matters because it gives Fugro exposure to both new project spending and recurring asset support work.
Geographically, Fugro is global, with operations spanning Europe-Africa, the Americas, Asia-Pacific, and the Middle East and India. That broad footprint helps it follow offshore wind, marine infrastructure, and energy spending in multiple regions rather than depending on one country.
The long-term pattern has been encouraging until the latest year shown: revenue and operating profit improved strongly from 2021 through 2024, while interest expense trended lower. The most recent year in the chart shows a sharp deterioration, including an operating loss and a small net loss, so the key question is whether that decline reflects a temporary setback or a more structural slowdown.
Key Figures
| Metric | Value | Sector ⓘ |
|---|---|---|
| Date | Oct 17, 2026 | |
| Context | ||
| Sector | Energy | |
| Industry | Oil & Gas Equipment & Services | |
| Market Cap ⓘ | $1.04B | |
| Beta ⓘ | 0.78 | |
Value (Cheapness) | ||
| P/E Ratio ⓘ | N/A | 15.44 |
| P/B Ratio ⓘ | N/A | 1.73 |
| FCF Yield ⓘ | N/A | 8.20% |
| Dividend Yield ⓘ | 1.60% | 3.59% |
| EBIT / EV ⓘ | N/A | 7.46% |
| PEG ⓘ | N/A | |
Growth (Business expansion) | ||
| Revenue Growth ⓘ | 1.70% | 26.90% |
| RPS Growth (5Y CAGR) ⓘ | 3.62% | 6.90% |
| EPS Growth (5Y CAGR) ⓘ | N/A | -15.73% |
| BVPS Growth (5Y CAGR) ⓘ | 8.64% | 6.07% |
| Margin Growth (5Y Trend) ⓘ | -8.67% | 0.58% |
| FCF Growth (5Y CAGR) ⓘ | N/A | 1.86% |
| DPS Growth (5Y CAGR) ⓘ | 127.61% | 16.79% |
Quality (Business durability) | ||
| ROIC (Latest) ⓘ | N/A | 11.40% |
| ROA (Latest) ⓘ | N/A | 6.06% |
| ROIC (5Y Median) ⓘ | N/A | 10.30% |
| ROA (5Y Median) ⓘ | 7.35% | 5.42% |
| Net Debt / EBIT (Latest) ⓘ | N/A | 1.64 |
| Net Debt / EBIT (5Y Median) ⓘ | N/A | 1.83 |
| Net Debt / EBITDA (Latest) ⓘ | N/A | 1.08 |
| Net Debt / Assets ⓘ | 9.82% | 17.29% |
| EBITDA / Interest ⓘ | N/A | 9.64 |
| Operating Margin (Latest) ⓘ | N/A | 16.27% |
| Operating Margin (5Y Median) ⓘ | 9.22% | 20.39% |
| Debt to Equity (Latest) ⓘ | N/A | 54.76% |
| Profit Margin (Latest) ⓘ | -3.45% | 8.82% |
| Free Cash Flow (Latest) ⓘ | N/A | |
Momentum (Price trend) | ||
| 3Y Return ⓘ | -38.35% | +67.38% |
| 12M Return (excl. last month) ⓘ | -18.91% | +49.19% |
| 6M Return ⓘ | -36.03% | +7.07% |
| Price vs. 200-Day MA ⓘ | -35.37% | +9.56% |
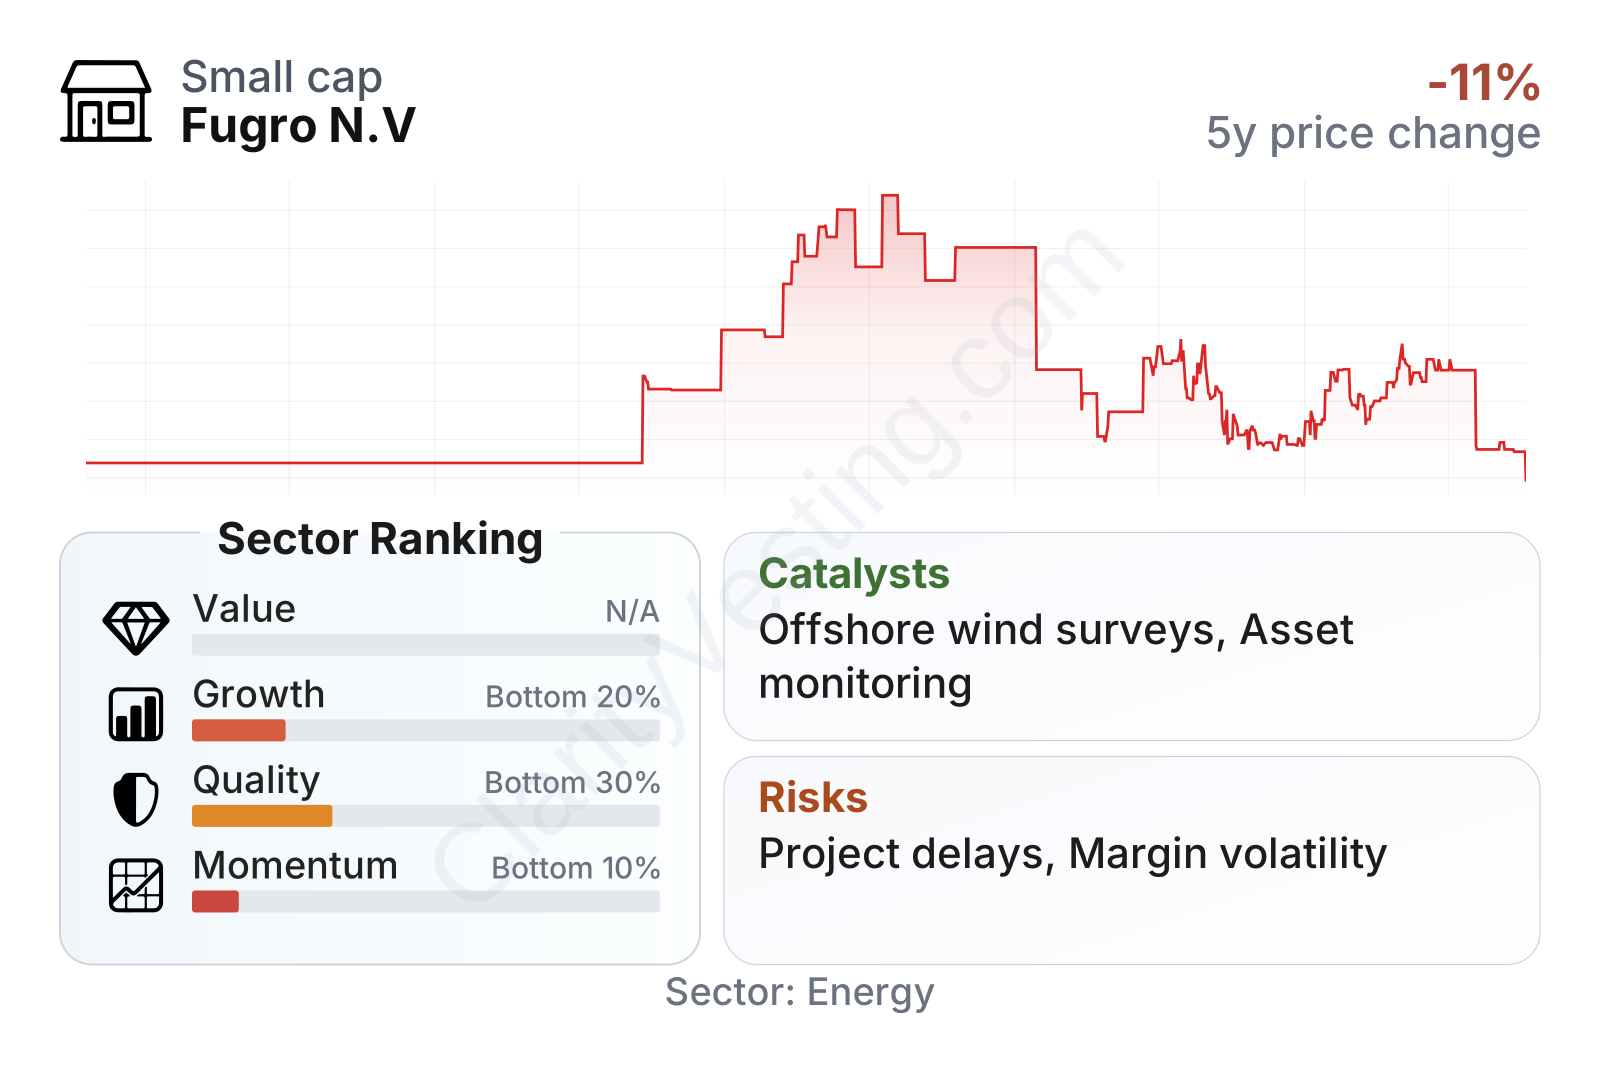
Fugro is a mid-sized company with a relatively low beta, which suggests the shares have historically moved less violently than many energy names. Even so, the stock’s recent market performance has been weak: returns over the last 6 months, the last year excluding the most recent month, and the last 3 years all trail the sector by a wide margin, and the share price remains well below its 200-day average.
The quality profile is mixed. Balance-sheet risk looks more contained than the sector median, with net debt representing about 10% of assets versus roughly 17% for the median peer group. That said, profitability is currently the weak spot. Profit margin is negative, and operating margins over time have been below many sector peers. Growth metrics are also soft in the latest snapshot, with year-over-year revenue growth at about 2%, far below the sector median. One brighter point is book value growth over five years, which has been better than the sector median, and dividend growth over five years has been strong, although the current dividend yield remains modest at about 1.6%.
Growth
Fugro operates in areas with credible long-term demand drivers. Offshore wind development needs seabed surveys, soil analysis, and installation support before turbines can be built. Aging offshore infrastructure needs inspection and integrity work. Climate adaptation also supports demand for coastal resilience, water management, and monitoring services. Governments and industrial owners are increasingly using remote and continuous monitoring to detect movement or deterioration earlier, which can lower maintenance costs and reduce safety risks.
The company’s strategy broadly fits these trends. Fugro has spent years shifting from a more cyclical oil-and-gas-centered profile toward a broader geodata model serving renewables, infrastructure, and water. It has also emphasized technology-led services such as remote operations, digital asset monitoring, and autonomous data collection. That direction makes strategic sense because digital and monitoring activities can be more repeatable and potentially less exposed to one-off vessel campaigns.
A meaningful catalyst is the continued buildout of offshore wind, especially in Europe and parts of Asia-Pacific and the Americas. Every major offshore project requires seabed and subsurface work before construction, and that is one of Fugro’s core capabilities. Another catalyst is the need to maintain and extend the life of existing offshore and civil infrastructure. Even if new project awards fluctuate, inspection and monitoring needs do not disappear.
Recent company communications have also highlighted contract wins and framework agreements tied to offshore wind surveys, marine site characterization, and infrastructure monitoring. Those announcements support the view that Fugro remains relevant in projects linked to the energy transition and resilient infrastructure spending. The important point for long-term analysis is not any single contract, but the evidence that its capabilities continue to fit markets where technical barriers and data quality matter.
Still, the current growth picture is less convincing than the industry theme. The latest comparative metrics place Fugro in the bottom 20% of the sector on growth, so the company is participating in attractive markets without currently converting that backdrop into peer-leading expansion. That gap between industry potential and company-level execution is one of the central issues in the investment case.
Risks
This article is for informational purposes only and does not constitute financial advice. Some content is AI-generated. See Disclaimer


