Stock Analysis · Fortrea Holdings Inc (FTRE)
Overview
Fortrea Holdings Inc is a contract research organization, often called a CRO. In simple terms, it helps drug makers, biotechnology companies, and medical device companies run clinical trials and other development work needed to bring treatments to market. Its services can cover the full path from early study planning to patient recruitment, site management, data collection, regulatory support, and post-approval work. Fortrea became an independent public company after being separated from Labcorp in 2023, so the current business is still in the middle of building its own systems, cost structure, and operating model.
The company mainly earns revenue by providing outsourced research and development services to pharmaceutical and biotech clients. Fortrea does not have a highly diversified consumer-style revenue mix; most of its business comes from service lines tied to clinical development programs. Based on company disclosures, revenue is primarily generated from the following areas:
- Clinical services for Phase I-IV trials: approximately 70% to 80% of revenue. This includes trial management, monitoring, patient enrollment support, data handling, and related operational work across many therapeutic areas.
- Enabling and advisory services: approximately 10% to 20% of revenue. This includes consulting, regulatory support, program design, and other specialized services that help clients move studies forward.
- Post-approval and other outsourced development services: approximately 5% to 10% of revenue. This can include market-access related support, safety-related activities, and ongoing evidence generation after a drug is launched.
Fortrea serves large pharmaceutical companies, smaller biotech firms, and other healthcare developers, giving it exposure to a broad customer base. That said, its economics depend heavily on new project awards, backlog conversion, trial execution quality, and how efficiently it manages labor-intensive global operations.
Over the last few years, revenue has stayed around the same broad range, but profitability has weakened sharply. Gross profit has narrowed, operating expenses rose meaningfully after the separation, and interest expense increased as debt became more important in the capital structure. That combination helps explain why cash generation has remained positive while accounting earnings have been under pressure.
The overall picture is a business with multibillion-dollar annual revenue and a large role in outsourced drug development, but one that is still trying to restore margins after becoming a stand-alone company.
Key Figures
| Metric | Value | Sector ⓘ |
|---|---|---|
| Date | Oct 03, 2026 | |
| Context | ||
| Sector | Healthcare | |
| Industry | Biotechnology | |
| Market Cap ⓘ | $1.90B | |
| Beta ⓘ | 1.95 | |
Value (Cheapness) | ||
| P/E Ratio ⓘ | N/A | 24.06 |
| P/B Ratio ⓘ | 3.49 | 3.08 |
| FCF Yield ⓘ | 7.94% | 3.07% |
| Dividend Yield ⓘ | N/A | 2.05% |
| EBIT / EV ⓘ | 0.10% | 0.63% |
| PEG ⓘ | 0.34 | |
Growth (Business expansion) | ||
| Revenue Growth ⓘ | -4.50% | 7.50% |
| RPS Growth (5Y CAGR) ⓘ | -3.61% | 8.70% |
| EPS Growth (5Y CAGR) ⓘ | -37.25% | -18.20% |
| BVPS Growth (5Y CAGR) ⓘ | -36.02% | 3.95% |
| Margin Growth (5Y Trend) ⓘ | -37.21% | -0.58% |
| FCF Growth (5Y CAGR) ⓘ | -11.40% | 0.88% |
| DPS Growth (5Y CAGR) ⓘ | N/A | 6.80% |
Quality (Business durability) | ||
| ROIC (Latest) ⓘ | 0.14% | 3.29% |
| ROA (Latest) ⓘ | -3.12% | 3.02% |
| ROIC (5Y Median) ⓘ | -4.05% | 4.75% |
| ROA (5Y Median) ⓘ | -4.44% | 1.93% |
| Net Debt / EBIT (Latest) ⓘ | 327.21 | 1.33 |
| Net Debt / EBIT (5Y Median) ⓘ | -0.13 | 1.83 |
| Net Debt / EBITDA (Latest) ⓘ | 11.69 | 0.99 |
| Net Debt / Assets ⓘ | 34.95% | 5.33% |
| EBITDA / Interest ⓘ | 0.97 | 9.63 |
| Operating Margin (Latest) ⓘ | 0.11% | 9.25% |
| Operating Margin (5Y Median) ⓘ | 1.38% | 7.80% |
| Debt to Equity (Latest) ⓘ | 213.18% | 28.99% |
| Profit Margin (Latest) ⓘ | -3.18% | 3.60% |
| Free Cash Flow (Latest) ⓘ | $150.60M | |
Momentum (Price trend) | ||
| 3Y Return ⓘ | -30.04% | +37.48% |
| 12M Return (excl. last month) ⓘ | +79.90% | +20.85% |
| 6M Return ⓘ | +104.00% | +9.73% |
| Price vs. 200-Day MA ⓘ | +27.94% | +4.69% |
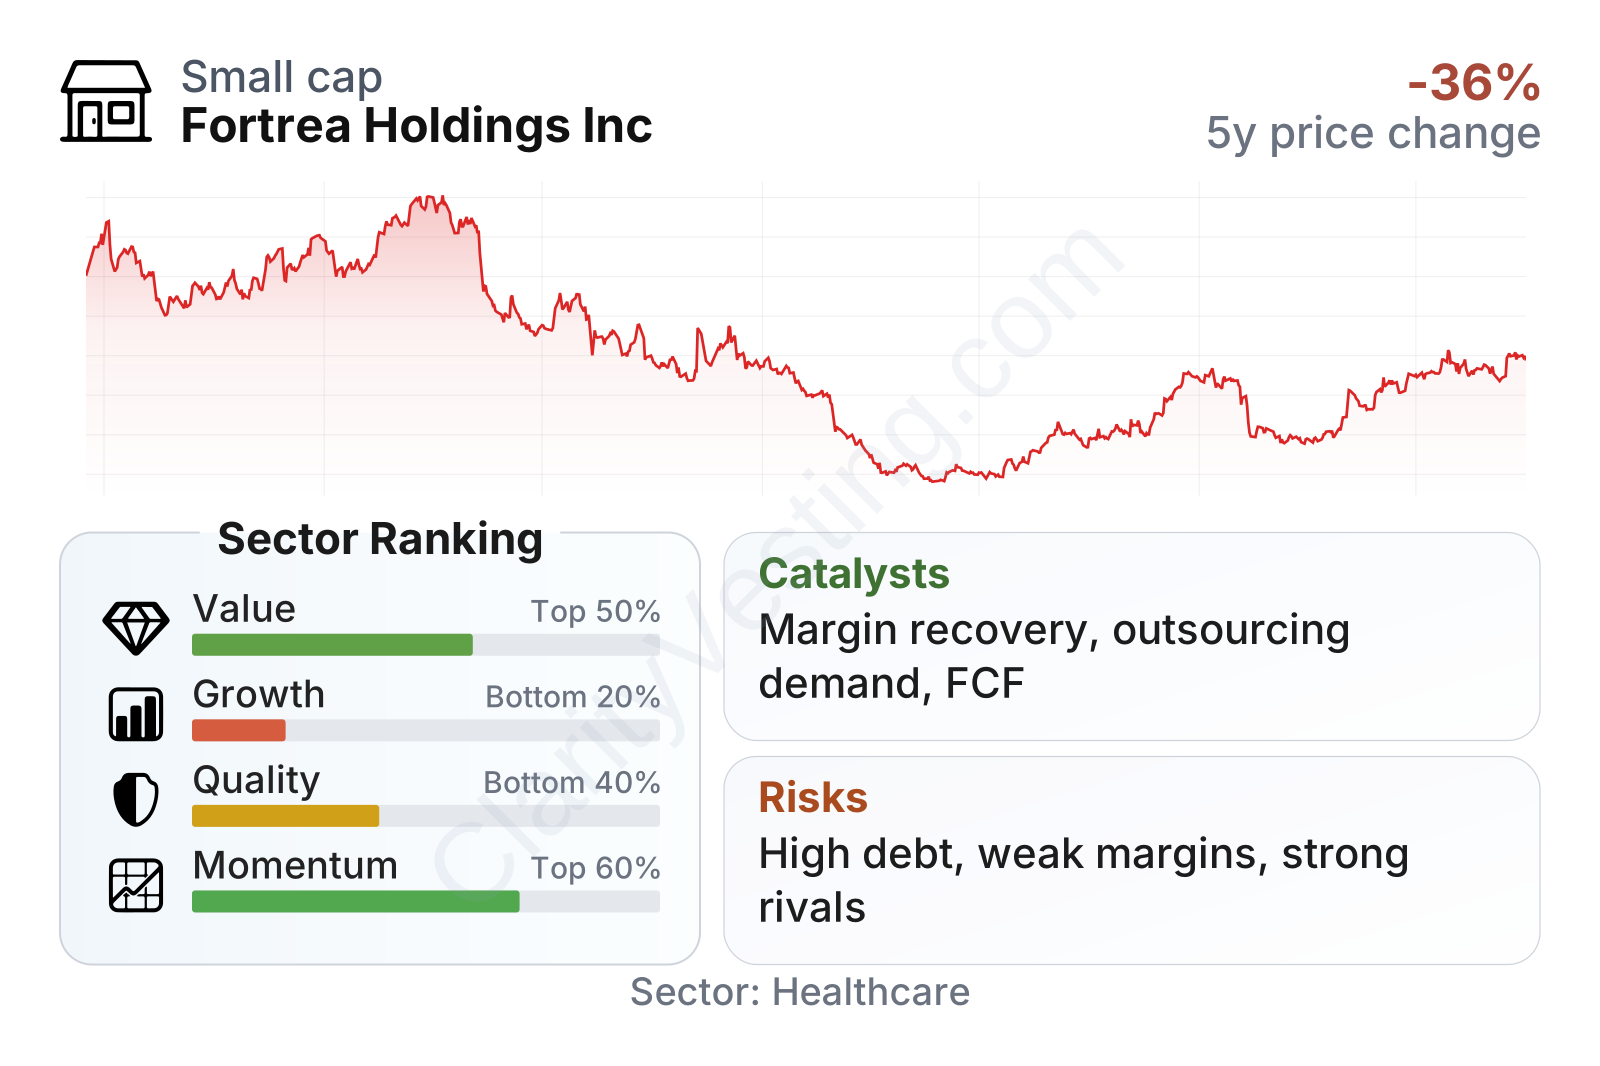
Fortrea is a mid-sized healthcare services company with a market value around $1.9 billion, and the stock has been notably volatile, with a beta close to 2. The factor profile is mixed. On valuation, the company screens better than many peers because free cash flow yield is relatively strong and the PEG ratio is low, but that comes with an important caveat: weak earnings and depressed profitability can make valuation ratios look more favorable than the business quality currently supports.
Growth metrics remain one of the weakest areas, ranking near the bottom of the sector. Revenue has recently declined year over year, longer-term per-share growth has been negative, and margin trends have deteriorated. Quality is also weak relative to peers, with very low returns on capital, negative return on assets, and leverage measures far above sector norms. Momentum is the exception: after a severe decline from its post-spin trading levels, the stock has staged a strong rebound over the last 6 to 12 months.
Growth
The broader sector backdrop is supportive. Drug development is becoming more complex, biotech pipelines remain active, and many sponsors continue to outsource clinical work rather than build everything internally. That gives CROs a structurally relevant role in healthcare. Long term, this is a real growth market because more therapies, more global trials, and more regulatory complexity generally increase the need for specialized outsourced partners.
For Fortrea specifically, the key question is less about whether the sector can grow and more about whether the company can capture that growth efficiently. Its strategy appears sensible on paper: focus on clinical development outsourcing, win new business, improve standalone operations after the separation, and convert bookings into more profitable revenue. The challenge is execution. A CRO can grow only if it manages staffing, project timelines, technology systems, and trial delivery without letting costs rise faster than revenue.
Recent revenue trends show that the recovery is not yet fully established. Growth has moved between modest declines and occasional positive quarters, which suggests demand is present but uneven. This is not the pattern of a business currently enjoying clean, broad-based expansion. Still, the fluctuations also indicate that a return to steadier growth is possible if backlog conversion and new awards improve.
One encouraging sign is cash generation. Free cash flow has improved from roughly the low-$100 million range to close to $200 million on a trailing basis. That matters because it shows the company is still producing cash even while reported earnings remain weak. For a business in transition, that creates some room to absorb restructuring work, service debt, and continue operational improvements.
A meaningful catalyst is the company’s multiyear effort to simplify its cost base and complete the transition away from its former parent’s infrastructure. If management can reduce separation-related friction, stabilize project execution, and rebuild margins, the business could look materially different from today’s income statement. Another potential opportunity comes from the industry’s push toward more outsourcing by biotech and pharmaceutical sponsors that want flexibility rather than fixed internal capacity.
Risks
This article is for informational purposes only and does not constitute financial advice. Some content is AI-generated. See Disclaimer


