Stock Analysis · FirstSun Capital Bancorp (FSUN)
Overview
FirstSun Capital Bancorp is a regional bank holding company. It operates primarily through Sunflower Bank, N.A. and provides traditional banking services such as commercial and industrial lending, commercial real estate lending, residential mortgage lending, treasury management, and deposit products for businesses and consumers. Its footprint is centered in western and southwestern growth markets, with operations across states including Texas, Arizona, Colorado, Kansas, and New Mexico.
Like most banks, FirstSun does not earn revenue in the same way as an industrial company. The largest driver is usually net interest income, which is the spread between what the bank earns on loans and securities and what it pays on deposits and borrowings. The second main source is noninterest income, which includes service charges, mortgage banking activity, wealth management, card and treasury fees, and other banking-related services. Based on the company’s recent annual profile, revenue appears to be concentrated as follows:
- Net interest income: approximately 75% to 85% of total revenue. This reflects interest earned on commercial loans, real estate loans, mortgage loans, and investment securities, minus funding costs.
- Noninterest income: approximately 15% to 25% of total revenue. This generally includes mortgage banking revenue, service charges and fees, card income, treasury management fees, and other customer service revenues.
That mix makes FirstSun mainly a balance-sheet-driven bank rather than a fee-driven financial company. Over the last several years, total revenue has expanded meaningfully, but profitability has moved around as funding costs and operating expenses changed with the interest-rate environment. Revenue rose from roughly $287 million in 2021 to about $570 million in 2025, while net income increased overall but with a noticeable dip in 2024 before recovering in 2025. This points to a bank that has grown its franchise, but still has earnings sensitivity to industry conditions.
The long-term pattern shows a much larger revenue base than a few years ago, but also higher interest expense and operating costs. In other words, growth has been real, yet the benefit to shareholders depends heavily on how efficiently the bank converts that larger balance sheet into profits.
Key Figures
| Metric | Value | Sector ⓘ |
|---|---|---|
| Date | Oct 24, 2026 | |
| Context | ||
| Sector | Financial Services | |
| Industry | Banks - Regional | |
| Market Cap ⓘ | $1.71B | |
| Beta ⓘ | 0.20 | |
Value (Cheapness) | ||
| P/E Ratio ⓘ | 23.36 | 12.46 |
| P/B Ratio ⓘ | 1.00 | 1.25 |
| FCF Yield ⓘ | 67.48% | 9.82% |
| Dividend Yield ⓘ | N/A | 2.94% |
| EBIT / EV ⓘ | 13.84% | 8.11% |
| PEG ⓘ | N/A | |
Growth (Business expansion) | ||
| Revenue Growth ⓘ | 42.20% | 9.10% |
| RPS Growth (5Y CAGR) ⓘ | 14.93% | 12.31% |
| EPS Growth (5Y CAGR) ⓘ | -11.07% | -6.97% |
| BVPS Growth (5Y CAGR) ⓘ | 17.98% | 5.02% |
| Margin Growth (5Y Trend) ⓘ | 3.92% | -4.00% |
| FCF Growth (5Y CAGR) ⓘ | -1.32% | 4.71% |
| DPS Growth (5Y CAGR) ⓘ | N/A | 8.92% |
Quality (Business durability) | ||
| ROIC (Latest) ⓘ | 8.30% | 9.18% |
| ROE (Latest) ⓘ | 3.15% | 13.93% |
| ROA (Latest) ⓘ | 0.39% | 1.57% |
| ROIC (5Y Median) ⓘ | 6.72% | 7.80% |
| ROE (5Y Median) ⓘ | 8.92% | 12.15% |
| ROA (5Y Median) ⓘ | 0.95% | 1.28% |
| Net Debt / EBIT (Latest) ⓘ | -5.19 | 1.02 |
| Net Debt / EBIT (5Y Median) ⓘ | -4.92 | 0.72 |
| Net Debt / EBITDA (Latest) ⓘ | -4.71 | 0.88 |
| Operating Margin (Latest) ⓘ | 21.03% | 22.30% |
| Operating Margin (5Y Median) ⓘ | 21.28% | 24.50% |
| Debt to Equity (Latest) ⓘ | 12.12% | 59.34% |
| Profit Margin (Latest) ⓘ | 10.46% | 26.42% |
| Free Cash Flow (Latest) ⓘ | $1.16B | |
Momentum (Price trend) | ||
| 3Y Return ⓘ | +34.73% | +95.73% |
| 12M Return (excl. last month) ⓘ | +0.15% | +17.30% |
| 6M Return ⓘ | +3.59% | +6.07% |
| Price vs. 200-Day MA ⓘ | +4.46% | +5.36% |
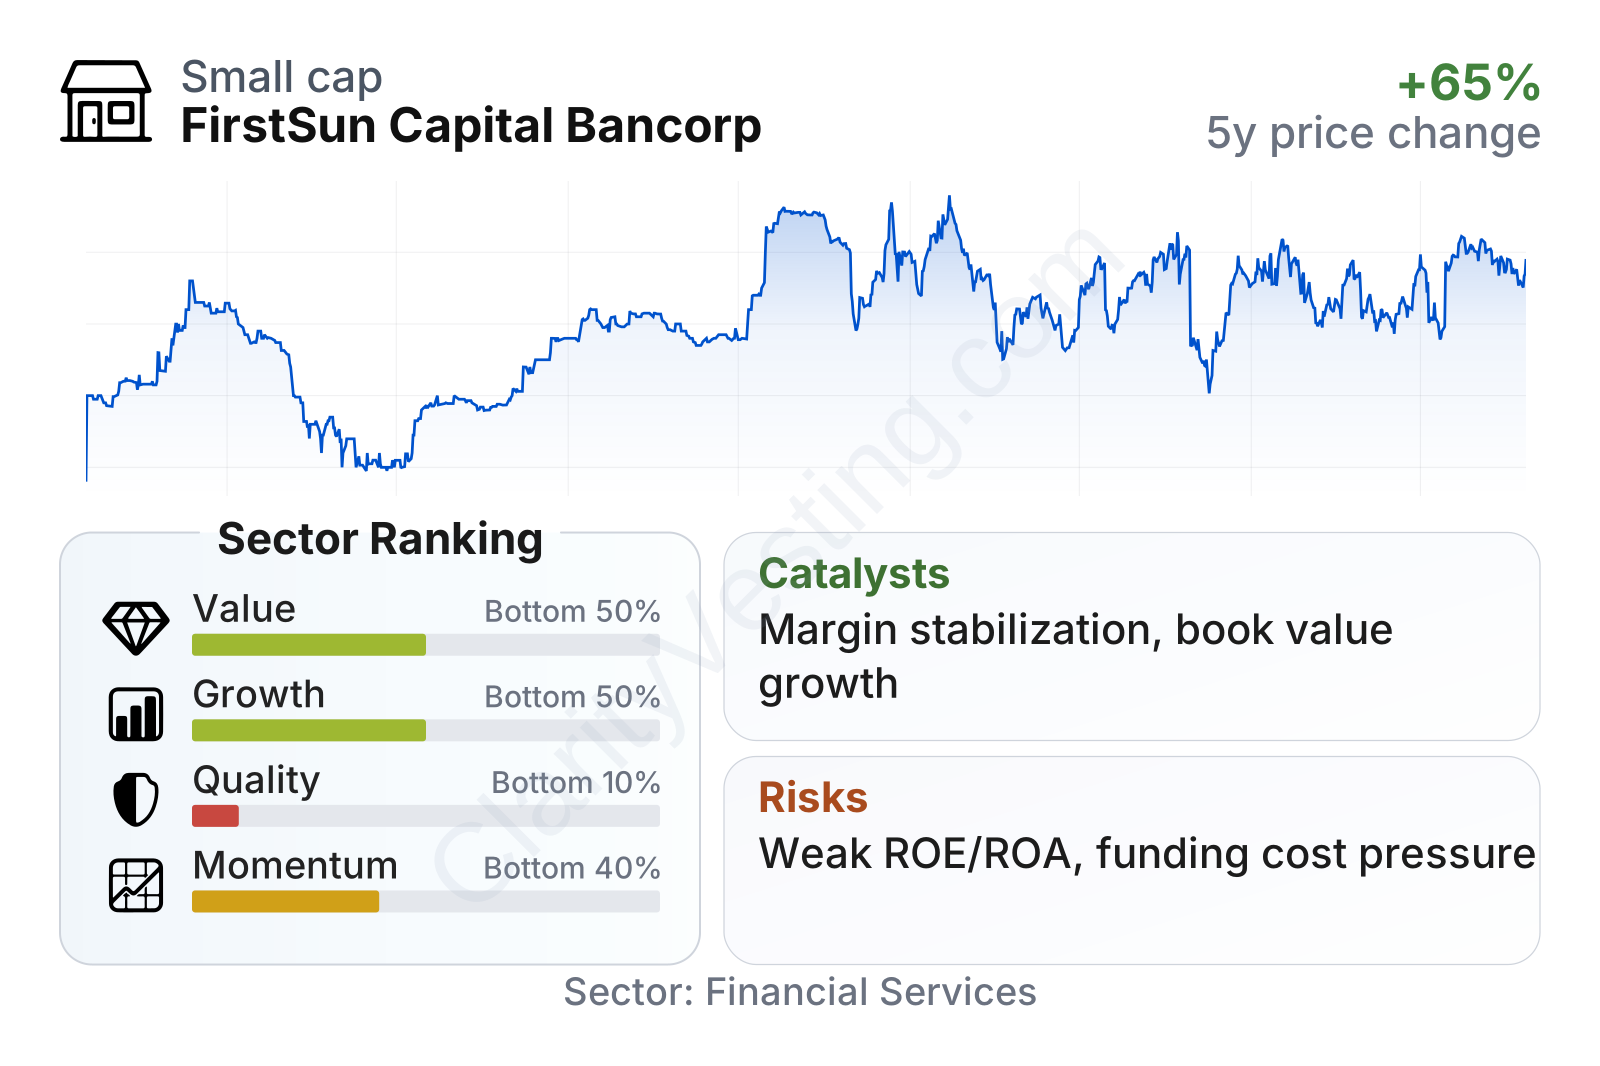
FirstSun sits in the middle of the regional banking pack on value and growth measures, but much weaker on quality and somewhat weaker on momentum. Revenue growth has clearly outpaced the sector median, and book value per share growth has also been strong. However, current profitability metrics are well below typical regional bank levels, which is the main reason the quality profile ranks poorly despite a conservative-looking balance sheet and low leverage.
The stock has also been volatile since its public listing, with several strong rebounds followed by pullbacks. That pattern suggests the market has not settled on a stable view of normalized earnings power yet. The relatively low beta indicates the shares have not moved as aggressively as many other stocks overall, but regional bank sentiment and earnings revisions still matter a lot for the trading pattern.
Growth
FirstSun operates in a sector that is mature, but not stagnant. Regional banking does not usually offer explosive growth, yet banks serving expanding metropolitan areas can still build deposits, win commercial clients, and increase lending faster than the national average. FirstSun’s footprint gives it exposure to several attractive markets in the Southwest and Mountain regions, where business formation, population migration, and commercial activity have been supportive for banking demand.
The company’s strategy appears logical for long-term expansion. It focuses on relationship banking, middle-market and commercial customers, and a branch network in faster-growing states rather than trying to compete head-on with the very largest national banks on scale. For a bank of this size, that can work well if management keeps credit quality disciplined and avoids overpaying for deposits.
Earnings per share show why the market remains cautious. EPS rose sharply from 2022 to 2023, fell in 2024, and improved again in 2025. That is progress, but not yet a smooth upward pattern. Long-term investors typically want to see earnings become more consistent, especially after a period of rapid balance-sheet growth.
Book value per share has been a much steadier positive. It has climbed strongly over the last five years and stands well above earlier levels. For a bank, that matters because book value reflects the equity base supporting future lending and earnings. The combination of strong book value growth and above-sector revenue growth suggests that the franchise has expanded, even if recent profitability has not fully caught up.
A meaningful catalyst is the possibility of margin stabilization. If deposit costs stop rising as quickly, or if loan yields remain favorable, earnings could improve without requiring dramatic balance-sheet growth. Another possible tailwind is greater operating leverage: after building a larger platform, even moderate revenue gains can have an outsized effect if expense growth stays contained. Recent company reporting has also highlighted continued loan and deposit franchise development, which matters because stable deposits are one of the most valuable assets for a regional bank.
Risks
This article is for informational purposes only and does not constitute financial advice. Some content is AI-generated. See Disclaimer


