Stock Analysis · Frasers Property Limited (FSRPF)
Overview
Frasers Property Limited is a Singapore-based real estate group with activities across residential development, commercial and business parks, retail, industrial and logistics properties, hospitality, and property management. Its footprint spans Singapore, Australia, China, Thailand, Vietnam, the United Kingdom, and parts of Europe. In simple terms, it earns money both by developing properties and selling them, and by owning properties that generate recurring rental and management income.
This mix matters for long-term analysis because the company is not tied to a single real estate niche. It has exposure to housing demand, warehouse and logistics trends, office and mixed-use projects, and recurring fees from asset and property management. That diversification can help smooth results, although it also makes the group more complex than a pure-play landlord or a pure homebuilder.
Based on the company’s recent annual reporting structure, the main revenue sources appear to come from the following areas:
- Sale of properties / development revenue: approximately 45% to 55% of group revenue in recent years. This includes residential projects and development completions, which can move up or down sharply depending on handovers and market conditions.
- Rental income from investment properties: approximately 20% to 30%. This includes malls, offices, business parks, industrial and logistics assets, and mixed-use properties held for recurring income.
- Hospitality revenue: approximately 10% to 20%. This comes from serviced residences, hotels, and related lodging operations under brands linked to the group.
- Property and asset management, service income, and other revenue: approximately 5% to 15%. This includes management fees, facilities services, and other supporting real estate activities.
The broad pattern is that Frasers Property combines cyclical development earnings with steadier rent and management streams. That can be attractive when leasing markets are firm, but it also means reported profit can be affected by asset sales, fair-value movements, project timing, and financing costs.
The operating picture shows that revenue has been uneven over the last few years, while interest expense has climbed materially. Gross profit has held up better than net income, which suggests that financing costs and below-the-line items have had a large influence on shareholder earnings.
Key Figures
| Metric | Value | Sector ⓘ |
|---|---|---|
| Date | Oct 03, 2026 | |
| Context | ||
| Sector | Real Estate | |
| Industry | Real Estate - Diversified | |
| Market Cap ⓘ | $3.10B | |
| Beta ⓘ | 0.42 | |
Value (Cheapness) | ||
| P/E Ratio ⓘ | 26.33 | 17.35 |
| P/B Ratio ⓘ | 1.42 | 0.86 |
| FCF Yield ⓘ | 23.81% | 7.47% |
| Dividend Yield ⓘ | 5.70% | 4.75% |
| EBIT / EV ⓘ | N/A | 3.81% |
| PEG ⓘ | N/A | |
Growth (Business expansion) | ||
| Revenue Growth ⓘ | -5.20% | 5.30% |
| RPS Growth (5Y CAGR) ⓘ | -5.52% | 5.96% |
| EPS Growth (5Y CAGR) ⓘ | 2.30% | -11.41% |
| BVPS Growth (5Y CAGR) ⓘ | -33.19% | 0.41% |
| Margin Growth (5Y Trend) ⓘ | -28.95% | 0.53% |
| FCF Growth (5Y CAGR) ⓘ | 32.73% | 5.40% |
| DPS Growth (5Y CAGR) ⓘ | 37.16% | 5.02% |
Quality (Business durability) | ||
| ROIC (Latest) ⓘ | N/A | 5.77% |
| ROE (Latest) ⓘ | 9.51% | 7.64% |
| ROA (Latest) ⓘ | 0.53% | 2.85% |
| ROIC (5Y Median) ⓘ | 5.63% | 4.20% |
| ROE (5Y Median) ⓘ | 7.87% | 6.03% |
| ROA (5Y Median) ⓘ | 0.61% | 2.45% |
| Net Debt / EBIT (Latest) ⓘ | 18.01 | 7.57 |
| Net Debt / EBIT (5Y Median) ⓘ | 9.16 | 8.41 |
| Net Debt / EBITDA (Latest) ⓘ | 16.63 | 5.12 |
| Net Debt / Assets ⓘ | 42.38% | 37.84% |
| EBITDA / Interest ⓘ | N/A | 4.11 |
| Operating Margin (Latest) ⓘ | 29.36% | 35.40% |
| Operating Margin (5Y Median) ⓘ | 36.52% | 36.59% |
| Debt to Equity (Latest) ⓘ | 196.51% | 89.06% |
| Profit Margin (Latest) ⓘ | 5.70% | 19.99% |
| Free Cash Flow (Latest) ⓘ | $738.59M | |
Momentum (Price trend) | ||
| 3Y Return ⓘ | +53.88% | +30.60% |
| 12M Return (excl. last month) ⓘ | +20.89% | +7.55% |
| 6M Return ⓘ | +0.08% | +0.69% |
| Price vs. 200-Day MA ⓘ | -5.06% | -2.30% |
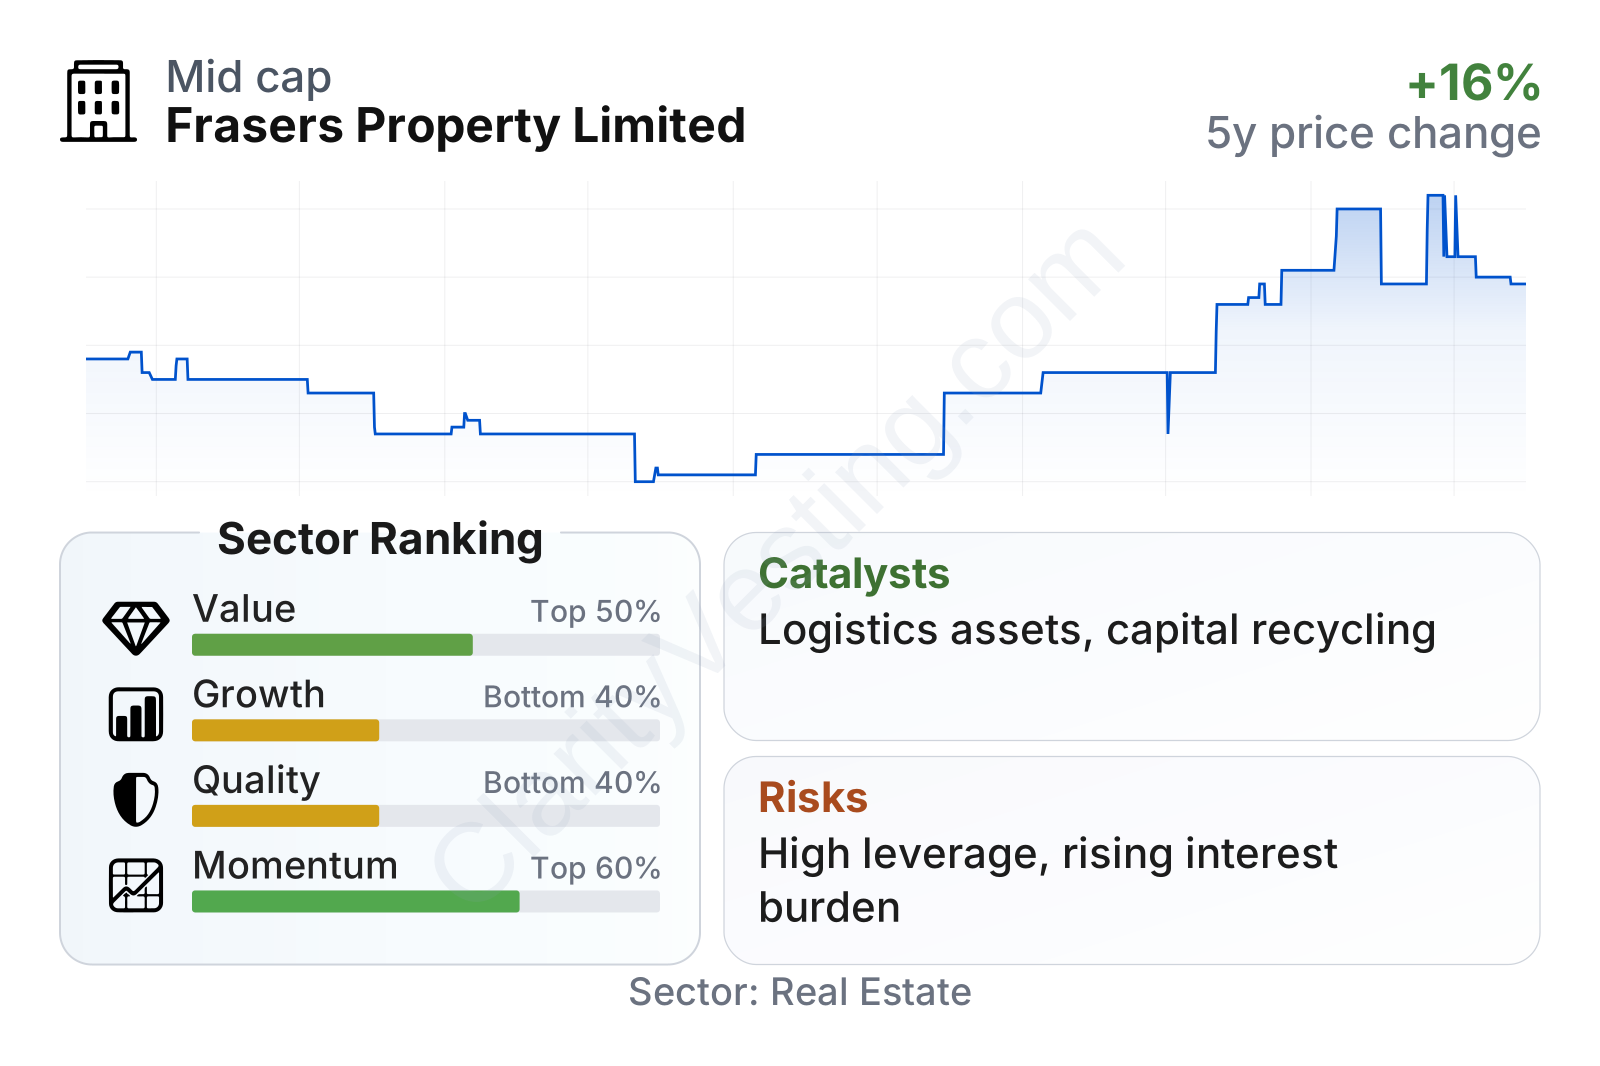
Frasers Property is a mid-sized listed real estate group with a stock-market value of roughly $3.1 billion and a relatively low beta of about 0.42, meaning its share price has historically moved less than the broader market. In the factor breakdown, the company scores better on value and is around the middle on momentum, but weaker on growth and quality versus the broader real estate sector.
The most notable positives in the metrics are a free cash flow yield above the sector median and a dividend yield around 5.7%, also above the sector median. The main pressure points are leverage and profitability: debt-to-equity is well above sector norms, net debt relative to EBIT and EBITDA is elevated, and profit margin is much thinner than the typical peer. That combination points to a company with meaningful asset backing and cash generation, but also one that remains highly exposed to the cost of debt and property-cycle swings.
Growth
Frasers Property operates in a sector that should continue to matter over the long term, but not every segment will grow at the same pace. The most favorable structural themes are in industrial and logistics, where demand is supported by supply-chain reconfiguration, e-commerce infrastructure, and modern warehousing needs. Mixed-use urban projects and recurring-income assets can also benefit from land scarcity in core markets such as Singapore and selected Australian cities. Hospitality has a longer runway tied to travel normalization and urban accommodation demand, although it is more cyclical than logistics.
The group’s strategy broadly makes sense for future growth because it combines capital recycling, recurring-income platforms, and development pipelines across several geographies. In practice, that means Frasers Property is trying to use development profits and asset monetization to refresh its portfolio while increasing the share of recurring earnings over time. For a real estate company, that is generally a more resilient model than relying only on one-off property sales.
Revenue per share shows the challenge clearly: there was improvement through 2024, followed by a visible drop in 2025. That does not necessarily mean the business model is broken, but it does show that growth is not currently consistent. Property groups often experience lumpy revenue recognition, especially when development completions shift between reporting periods, so the bigger question is whether recurring rental and management income can become a larger stabilizer.
Dividend per share improved significantly from 2022 to 2024 and then held steady in 2025. That signals management has, at least recently, been willing to return more cash to shareholders despite volatile earnings. Combined with strong free cash flow growth over the last five years, this is one of the more constructive elements in the company’s profile.
A key catalyst is the company’s exposure to logistics, industrial, and business park assets in Asia-Pacific and Europe, where occupier demand has generally been more durable than in traditional office markets. Another is capital recycling: if Frasers Property can continue selling mature assets, stabilizing developments, and redeploying capital into higher-demand segments, earnings quality could improve over time. Recent company communications have also emphasized portfolio optimization, disciplined capital management, and strengthening recurring income streams, which is important in a higher-rate environment.
The stock’s longer-term price trend has turned more constructive since late 2024, which suggests the market has started to recognize improving operating stability or balance-sheet expectations. Even so, the recent six-month pullback indicates that confidence is not yet fully settled.
Risks
This article is for informational purposes only and does not constitute financial advice. Some content is AI-generated. See Disclaimer


