Stock Analysis · FS KKR Capital Corp (FSK)
Overview
FS KKR Capital Corp is a business development company, or BDC. In simple terms, it lends money to and invests in privately owned U.S. companies that are usually too large for small-business lending but too small to easily issue public bonds or stock. The company is externally managed by FS/KKR Advisor, which combines the distribution network of FS Investments with KKR’s credit platform.
Its portfolio is focused mainly on senior secured loans. These are loans that stand near the front of the line if a borrower runs into trouble, which matters because capital preservation is a central part of the BDC model. FSK invests primarily in middle-market companies across many industries, with a strong emphasis on directly originated loans rather than broadly traded securities.
Revenue for a BDC does not look like revenue for a manufacturer or software company. The main economic engine is investment income generated by the loan and investment portfolio. Based on recent company filings, the mix is broadly concentrated in recurring interest income, with smaller contributions from fee income and dividend income, while realized and unrealized gains or losses can materially affect reported earnings from period to period.
- Interest income from debt investments: approximately 85% to 95% of total investment income in recent periods. This mainly comes from first-lien and second-lien loans, many of which have floating rates.
- Payment-in-kind income and fee income: generally a mid-single-digit share of investment income. This can include original issue discounts, prepayment fees, amendment fees, and non-cash interest that accrues to the loan balance.
- Dividend income from equity and preferred investments: usually a low-single-digit share. These investments can also create upside if portfolio companies are sold or refinanced.
- Net realized and unrealized gains or losses: highly variable and not a stable operating revenue source, but often very important for net income and net asset value.
One useful way to think about FSK is as an income-focused credit vehicle whose results are driven by three moving parts: the size of its portfolio, the interest rates earned on loans, and the credit quality of the companies it finances.
The earnings flow has been volatile over the last several years. Revenue and gross profit recovered after the weak 2022 period, but net income has been much less stable because interest expense, credit marks, and portfolio valuation changes can swing results sharply from one year to another.
Key Figures
| Metric | Value | Sector ⓘ |
|---|---|---|
| Date | Oct 17, 2026 | |
| Context | ||
| Sector | Financial Services | |
| Industry | Asset Management | |
| Market Cap ⓘ | $2.91B | |
| Beta ⓘ | 0.93 | |
Value (Cheapness) | ||
| P/E Ratio ⓘ | N/A | 12.26 |
| P/B Ratio ⓘ | 0.57 | 1.23 |
| FCF Yield ⓘ | 45.56% | 10.40% |
| Dividend Yield ⓘ | 20.09% | 3.02% |
| EBIT / EV ⓘ | N/A | 8.14% |
| PEG ⓘ | 3.27 | |
Growth (Business expansion) | ||
| Revenue Growth ⓘ | -27.10% | 9.35% |
| RPS Growth (5Y CAGR) ⓘ | -4.88% | 12.19% |
| EPS Growth (5Y CAGR) ⓘ | -28.89% | -9.53% |
| BVPS Growth (5Y CAGR) ⓘ | -13.04% | 4.99% |
| Margin Growth (5Y Trend) ⓘ | -99.67% | -3.86% |
| FCF Growth (5Y CAGR) ⓘ | N/A | 4.81% |
| DPS Growth (5Y CAGR) ⓘ | 4.23% | 8.79% |
Quality (Business durability) | ||
| ROIC (Latest) ⓘ | N/A | 9.49% |
| ROE (Latest) ⓘ | -6.56% | 13.90% |
| ROA (Latest) ⓘ | -2.90% | 1.55% |
| ROIC (5Y Median) ⓘ | 6.65% | 7.86% |
| ROE (5Y Median) ⓘ | 8.69% | 12.17% |
| ROA (5Y Median) ⓘ | 3.94% | 1.30% |
| Net Debt / EBIT (Latest) ⓘ | N/A | 0.96 |
| Net Debt / EBIT (5Y Median) ⓘ | 6.19 | 0.73 |
| Net Debt / EBITDA (Latest) ⓘ | 151.52 | 0.92 |
| Operating Margin (Latest) ⓘ | N/A | 22.30% |
| Operating Margin (5Y Median) ⓘ | 141.26% | 24.63% |
| Debt to Equity (Latest) ⓘ | 122.84% | 58.56% |
| Profit Margin (Latest) ⓘ | -28.52% | 26.57% |
| Free Cash Flow (Latest) ⓘ | $1.33B | |
Momentum (Price trend) | ||
| 3Y Return ⓘ | -13.03% | +88.33% |
| 12M Return (excl. last month) ⓘ | -15.65% | +19.38% |
| 6M Return ⓘ | +4.23% | +4.75% |
| Price vs. 200-Day MA ⓘ | -0.44% | +3.50% |
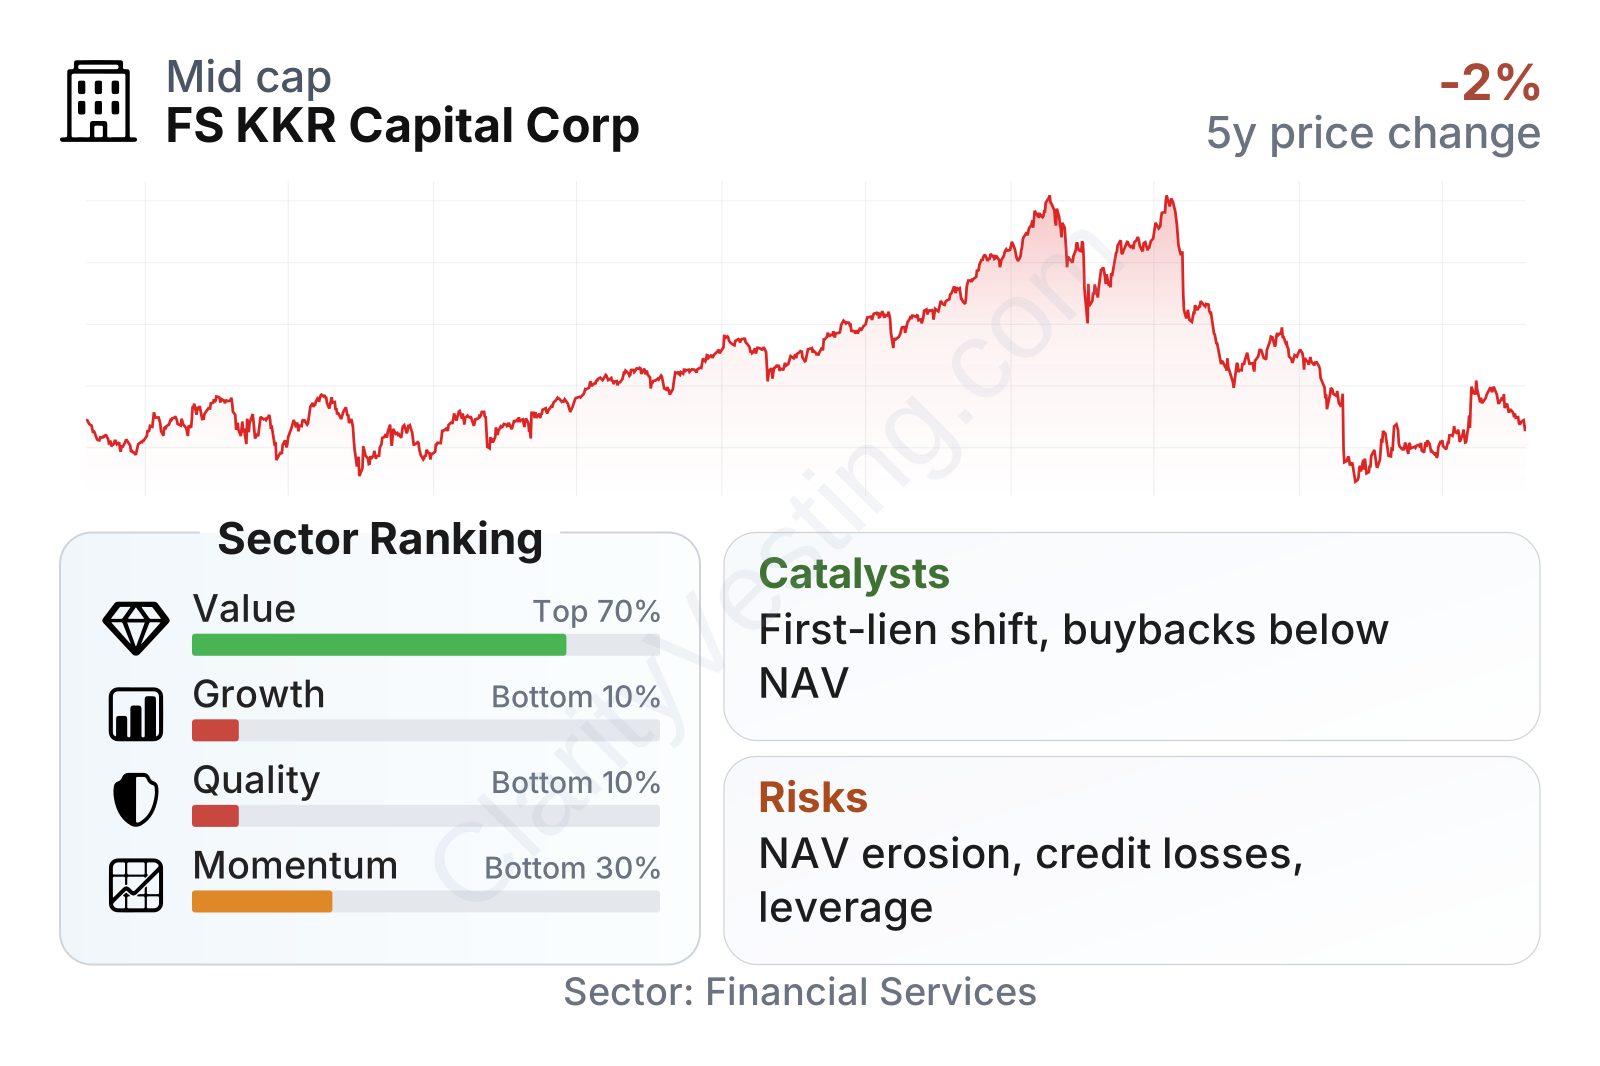
FSK is a mid-sized public company within financial services and shows a mixed profile. On valuation, it screens cheaply relative to much of the sector, especially on price-to-book and dividend yield. On the other hand, growth and quality metrics are weak, with declining revenue, earnings, and book value over multi-year periods. Share price performance has also been uneven: there was a strong rebound into 2024 and parts of 2025, followed by a sharp setback and only partial recovery in 2026.
The high indicated yield stands out, but in a BDC that figure needs to be read alongside net asset value, credit performance, and earnings coverage rather than on its own. The table also shows why the market remains cautious: low valuation appears tied to deteriorating fundamentals, not just market neglect.
Growth
FSK operates in private credit, a part of the market that has expanded meaningfully over the last decade. As banks have become more selective in middle-market lending, non-bank lenders such as BDCs and private credit funds have taken a larger role. That broad industry backdrop is favorable because companies continue to need flexible financing, especially for acquisitions, refinancings, and sponsor-backed transactions.
Its strategy also has a clear logic for future growth. FSK is heavily oriented toward senior secured lending, and the KKR relationship gives it sourcing, underwriting resources, and access to a broad sponsor network. That can help the company find deals at scale and manage troubled positions more effectively than smaller independent BDCs. In addition, a portfolio tilted toward floating-rate loans can support income when base rates remain elevated.
Earnings per share rose through 2023, then weakened in 2024 and 2025, with 2026 still running at a lower level. That pattern suggests the platform can generate strong income in supportive credit conditions, but it also shows that earnings power is not moving in a straight line. For a long-term view, stability matters as much as peak income.
Book value per share has trended downward over the past several years. For a BDC, that is an important signal because book value reflects the marked value of the investment portfolio after liabilities. A declining trend can mean credit losses, weaker valuations, or distributions that exceed long-run economic gains. Even in a growing private credit market, durable compounding is harder when book value keeps eroding.
A notable catalyst is portfolio repositioning toward larger first-lien exposure and continued use of asset sales, repayments, and originations to improve portfolio quality. Company updates in 2026 also continued to emphasize non-accrual management, liability optimization, and active repurchases below net asset value. When a BDC trades materially below book value, buybacks can be economically attractive because each repurchased share can increase value per remaining share if the balance sheet remains sound.
Another industry-level opportunity is refinancing demand. Many middle-market borrowers still face maturities that were arranged in a very different rate environment. A manager with scale, sponsor relationships, and restructuring experience can benefit from that need for capital, although it comes with underwriting risk.
Risks
This article is for informational purposes only and does not constitute financial advice. Some content is AI-generated. See Disclaimer


