Stock Analysis · Frasers Logistics & Commercial Trust (FRLOF)
Overview
Frasers Logistics & Commercial Trust is a Singapore-listed real estate investment trust, or REIT, focused mainly on income-producing industrial and commercial properties. Its portfolio spans logistics facilities, warehouses, business parks, and selected office assets across developed markets including Australia, Europe, Singapore, and the United Kingdom. In simple terms, the trust owns buildings that tenants use for storage, distribution, light industrial activity, offices, and business operations, and it collects rent from those tenants.
The business model is straightforward: acquire and manage properties, keep occupancy high, secure long leases where possible, and use rental income to support distributions after expenses, interest, and asset management costs. Because it is a REIT, property values, financing costs, and tenant demand are central to performance.
The main revenue source is rental and related property income from its portfolio. Based on the trust’s portfolio mix in recent annual reporting, the income base is heavily tilted toward logistics and industrial assets, with commercial offices and business parks making up the rest.
- Logistics and industrial properties: approximately 65% to 75% of portfolio value and the main contributor to rental income. This includes distribution centers, warehouses, and industrial facilities used by supply chain, manufacturing, and e-commerce tenants.
- Commercial properties: approximately 25% to 35% of portfolio value. This includes office buildings and business parks, mainly in developed urban markets.
- Geographic diversification: Australia is the largest market, followed by Europe, then Singapore and the UK. Exact revenue by country is not always presented in the same format as property value, but the trust is clearly not dependent on a single city or one single tenant market.
This mix matters because logistics assets usually benefit from structural demand tied to supply chains and e-commerce, while office exposure brings both diversification and additional uncertainty.
Over the last few years, revenue has stayed broadly stable and then improved, while profitability has been more volatile because property businesses are affected by valuation movements and financing costs. The operating structure remains efficient, with very high underlying margins for a landlord business.
Key Figures
| Metric | Value | Sector ⓘ |
|---|---|---|
| Date | Oct 03, 2026 | |
| Context | ||
| Sector | Real Estate | |
| Industry | REIT - Industrial | |
| Market Cap ⓘ | $2.84B | |
| Beta ⓘ | 0.64 | |
Value (Cheapness) | ||
| P/E Ratio ⓘ | 18.66 | 17.35 |
| P/B Ratio ⓘ | 0.53 | 0.86 |
| FCF Yield ⓘ | 16.75% | 7.47% |
| Dividend Yield ⓘ | 7.90% | 4.75% |
| EBIT / EV ⓘ | N/A | 3.81% |
| PEG ⓘ | 7.24 | |
Growth (Business expansion) | ||
| Revenue Growth ⓘ | 2.80% | 5.30% |
| RPS Growth (5Y CAGR) ⓘ | 4.77% | 5.96% |
| EPS Growth (5Y CAGR) ⓘ | 23.21% | -11.41% |
| BVPS Growth (5Y CAGR) ⓘ | 1.71% | 0.41% |
| Margin Growth (5Y Trend) ⓘ | -122.66% | 0.53% |
| FCF Growth (5Y CAGR) ⓘ | -2.01% | 5.40% |
| DPS Growth (5Y CAGR) ⓘ | -0.50% | 5.02% |
Quality (Business durability) | ||
| ROIC (Latest) ⓘ | 8.02% | 5.77% |
| ROE (Latest) ⓘ | 8.23% | 7.64% |
| ROA (Latest) ⓘ | 4.81% | 2.85% |
| ROIC (5Y Median) ⓘ | 4.50% | 4.20% |
| ROE (5Y Median) ⓘ | 4.94% | 6.03% |
| ROA (5Y Median) ⓘ | 2.83% | 2.45% |
| Net Debt / EBIT (Latest) ⓘ | 3.84 | 7.57 |
| Net Debt / EBIT (5Y Median) ⓘ | 4.93 | 8.41 |
| Net Debt / EBITDA (Latest) ⓘ | 3.84 | 5.12 |
| Net Debt / Assets ⓘ | 32.49% | 37.84% |
| EBITDA / Interest ⓘ | 3.10 | 4.11 |
| Operating Margin (Latest) ⓘ | 65.27% | 35.40% |
| Operating Margin (5Y Median) ⓘ | 73.79% | 36.59% |
| Debt to Equity (Latest) ⓘ | 58.36% | 89.06% |
| Profit Margin (Latest) ⓘ | 44.54% | 19.99% |
| Free Cash Flow (Latest) ⓘ | $476.28M | |
Momentum (Price trend) | ||
| 3Y Return ⓘ | +22.57% | +30.60% |
| 12M Return (excl. last month) ⓘ | +15.11% | +7.55% |
| 6M Return ⓘ | +14.60% | +0.69% |
| Price vs. 200-Day MA ⓘ | +2.32% | -2.30% |
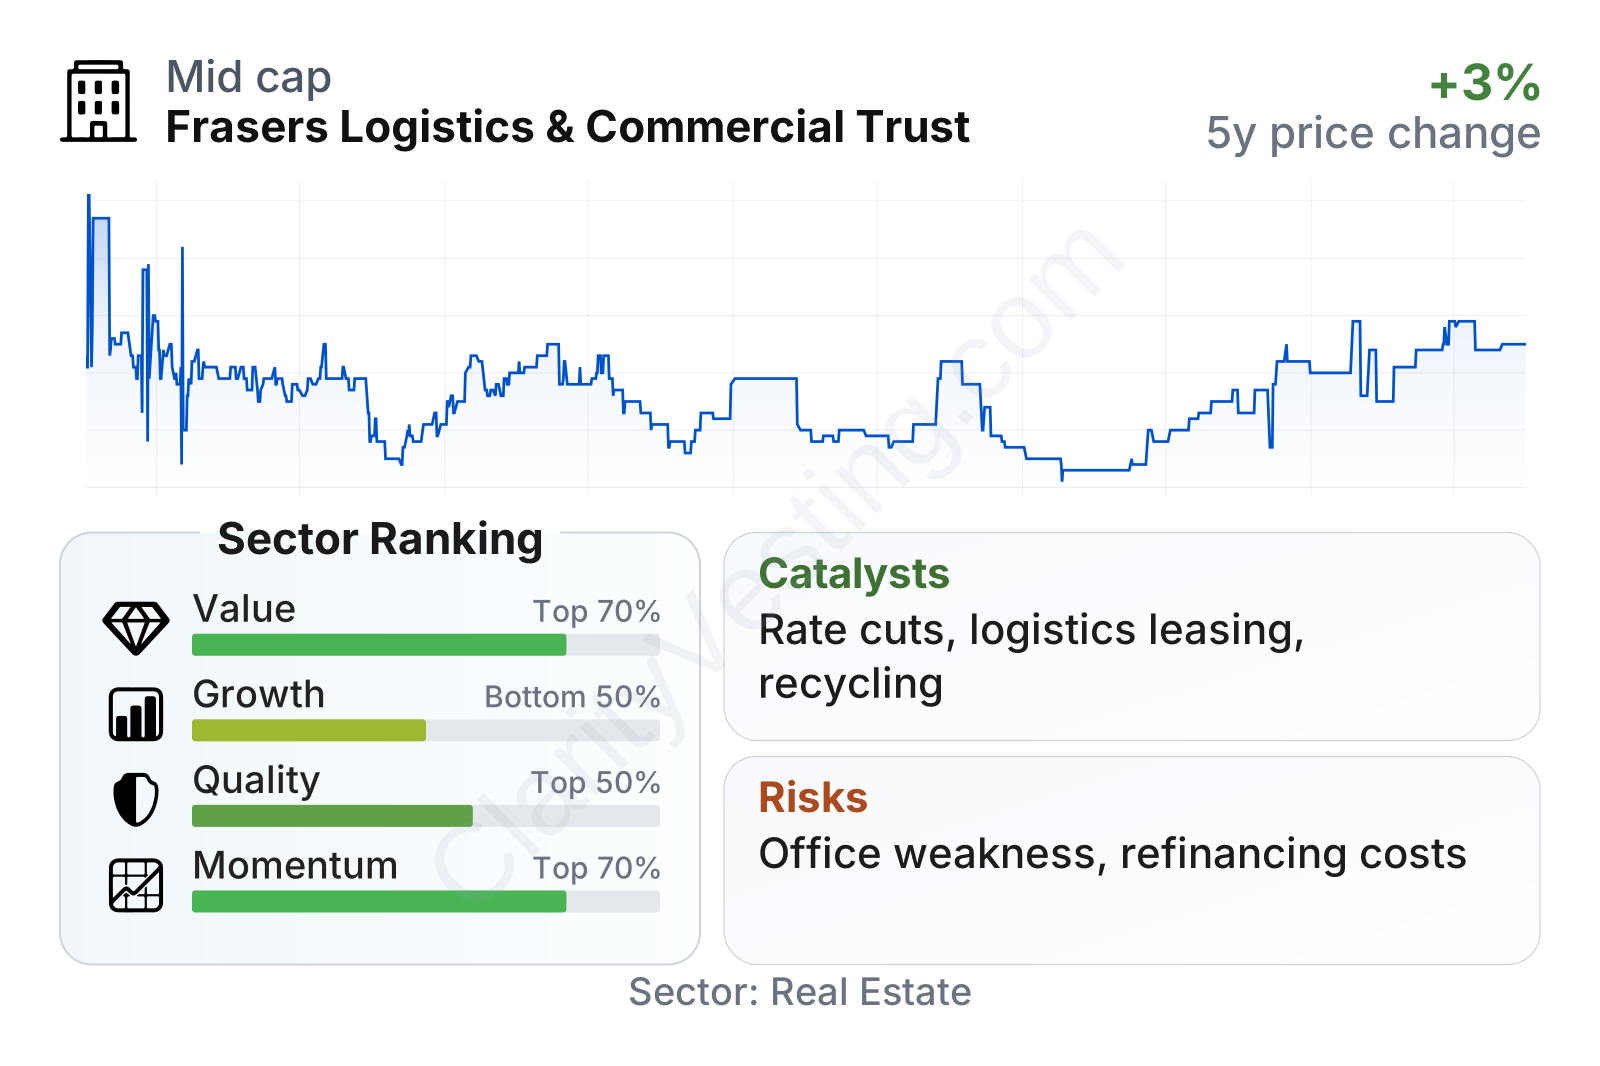
Frasers Logistics & Commercial Trust is a mid-sized REIT with relatively low share-price volatility, as shown by its beta below 1. On valuation, it looks mixed: the earnings multiple is close to the sector median, but the price-to-book ratio is clearly below the sector norm. Income generation stands out more positively, with free cash flow yield and dividend yield both ahead of many peers.
Quality is one of the stronger parts of the profile. Profitability ratios are generally above sector medians, leverage is lower than many peers on debt-to-equity and net-debt-to-EBITDA, and margins are strong for the industry. The weaker area is growth: recent revenue expansion has been modest versus the broader real estate group, and dividend growth over five years has been slightly negative. Market performance has improved more recently, with stronger six- and twelve-month price momentum than the sector median.
Growth
Frasers Logistics & Commercial Trust operates in a sector with a favorable long-term backdrop, especially on the logistics side. Modern supply chains need well-located warehouses, distribution hubs, and industrial space, and that demand has been supported by e-commerce, inventory management changes, and the need for resilient delivery networks. These trends are not new, but they continue to support rent resilience and tenant demand in many developed markets.
The trust’s strategy is sensible for long-term expansion because it combines three useful features: exposure to logistics properties, geographic diversification, and active capital recycling. In practice, that means management can sell lower-growth or non-core properties, reinvest into assets with better income potential, and gradually improve portfolio quality. This approach is especially important in real estate, where value creation often comes from asset mix, lease management, and financing discipline rather than dramatic top-line growth.
Revenue per share dipped in 2023 and then recovered, with a much clearer improvement by 2025. That pattern suggests the portfolio has moved through a softer period and returned to better income generation, though growth is not yet fast enough to place the trust among the stronger growers in the sector.
Distributions have also been fairly resilient. The longer five-year trend is close to flat, but the latest annual figure moved above earlier levels. For a REIT, that signals that income stability remains largely intact even after a period of higher interest costs and weaker property market sentiment.
A meaningful catalyst is the path of interest rates. REITs are sensitive to borrowing costs because debt is part of the business model and because lower rates tend to support property values. If refinancing conditions improve further, Frasers Logistics & Commercial Trust could benefit through lower interest expense, firmer asset valuations, and stronger market appetite for income-producing real estate.
Another catalyst is leasing and occupancy execution within the logistics portfolio. Industrial properties often have better structural demand than offices, so maintaining occupancy and capturing rental reversions can support gradual earnings growth. In addition, any continued shift in the portfolio toward logistics and away from weaker office exposure would likely improve the trust’s long-term growth profile.
Risks
This article is for informational purposes only and does not constitute financial advice. Some content is AI-generated. See Disclaimer


