Stock Analysis · Fortune Real Estate Investment Trust (FRIVF)
Overview
Fortune Real Estate Investment Trust is a Hong Kong-focused retail REIT. In simple terms, it owns shopping centers and retail spaces, then earns rental income from the tenants operating inside those properties. Its portfolio is mainly made up of neighborhood malls and community retail assets that serve day-to-day spending rather than luxury destination shopping. That makes the business more tied to local consumption, supermarket traffic, dining, services, and essential retail activity.
The trust’s revenue comes primarily from leasing space and the property-related income attached to operating retail real estate. Based on the latest annual disclosures and portfolio description, the main revenue sources can be summarized as follows:
- Base rental income: the largest source, generated from tenants paying regular contracted rent for shop space.
- Management and service income: property management fees, air-conditioning charges, promotion levies, and other occupier-related recoveries.
- Turnover-linked or variable rent: a smaller contribution tied to tenant sales where applicable.
- Car park and ancillary income: a modest contribution from parking and other supporting uses where available.
For most retail REITs structured like Fortune REIT, base rent and related property income usually account for a very large majority of recurring revenue, while variable rent and ancillary items remain much smaller. The business model is therefore relatively easy to understand: occupancy, rent levels, lease renewals, and financing costs are the main drivers of results.
Over the last several years, revenue has stayed broadly stable in local currency terms, but profitability has been much more volatile. The operating picture remained resilient at the property level, yet higher financing costs and weaker valuation movements weighed heavily on reported earnings. That distinction matters for REIT analysis because accounting profit can swing more sharply than cash rental income.
The long-term pattern shows a property business with steady top-line rental income but much more pressure further down the income statement. Revenue has moved within a fairly narrow band, while interest expense rose sharply from 2021 through 2024 before easing somewhat in 2025. That helps explain why operating performance and bottom-line profit diverged so much.
Key Figures
| Metric | Value | Sector ⓘ |
|---|---|---|
| Date | Oct 17, 2026 | |
| Context | ||
| Sector | Real Estate | |
| Industry | REIT - Retail | |
| Market Cap ⓘ | $1.09B | |
| Beta ⓘ | 0.83 | |
Value (Cheapness) | ||
| P/E Ratio ⓘ | N/A | 17.38 |
| P/B Ratio ⓘ | 0.01 | 0.85 |
| FCF Yield ⓘ | 110.48% | 7.38% |
| Dividend Yield ⓘ | 65.15% | 4.85% |
| EBIT / EV ⓘ | N/A | 3.78% |
| PEG ⓘ | N/A | |
Growth (Business expansion) | ||
| Revenue Growth ⓘ | -3.90% | 5.30% |
| RPS Growth (5Y CAGR) ⓘ | 64.19% | 6.02% |
| EPS Growth (5Y CAGR) ⓘ | -69.43% | -11.37% |
| BVPS Growth (5Y CAGR) ⓘ | 59.28% | 0.45% |
| Margin Growth (5Y Trend) ⓘ | -122.21% | -0.22% |
| FCF Growth (5Y CAGR) ⓘ | -10.40% | 5.40% |
| DPS Growth (5Y CAGR) ⓘ | 53.96% | 5.02% |
Quality (Business durability) | ||
| ROIC (Latest) ⓘ | N/A | 5.69% |
| ROE (Latest) ⓘ | -4.69% | 7.56% |
| ROA (Latest) ⓘ | -3.24% | 2.85% |
| ROIC (5Y Median) ⓘ | 0.76% | 4.22% |
| ROE (5Y Median) ⓘ | -0.54% | 6.03% |
| ROA (5Y Median) ⓘ | -0.39% | 2.44% |
| Net Debt / EBIT (Latest) ⓘ | N/A | 7.59 |
| Net Debt / EBIT (5Y Median) ⓘ | 14.52 | 8.40 |
| Net Debt / EBITDA (Latest) ⓘ | 7.15 | 5.27 |
| Net Debt / Assets ⓘ | 26.49% | 37.76% |
| EBITDA / Interest ⓘ | 1.84 | 4.10 |
| Operating Margin (Latest) ⓘ | N/A | 35.29% |
| Operating Margin (5Y Median) ⓘ | 25.55% | 37.31% |
| Debt to Equity (Latest) ⓘ | 39.18% | 88.87% |
| Profit Margin (Latest) ⓘ | -5.26% | 19.61% |
| Free Cash Flow (Latest) ⓘ | $1.21B | |
Momentum (Price trend) | ||
| 3Y Return ⓘ | +3.66% | +30.75% |
| 12M Return (excl. last month) ⓘ | -15.07% | +4.36% |
| 6M Return ⓘ | +7.87% | -2.52% |
| Price vs. 200-Day MA ⓘ | +12.27% | -2.34% |
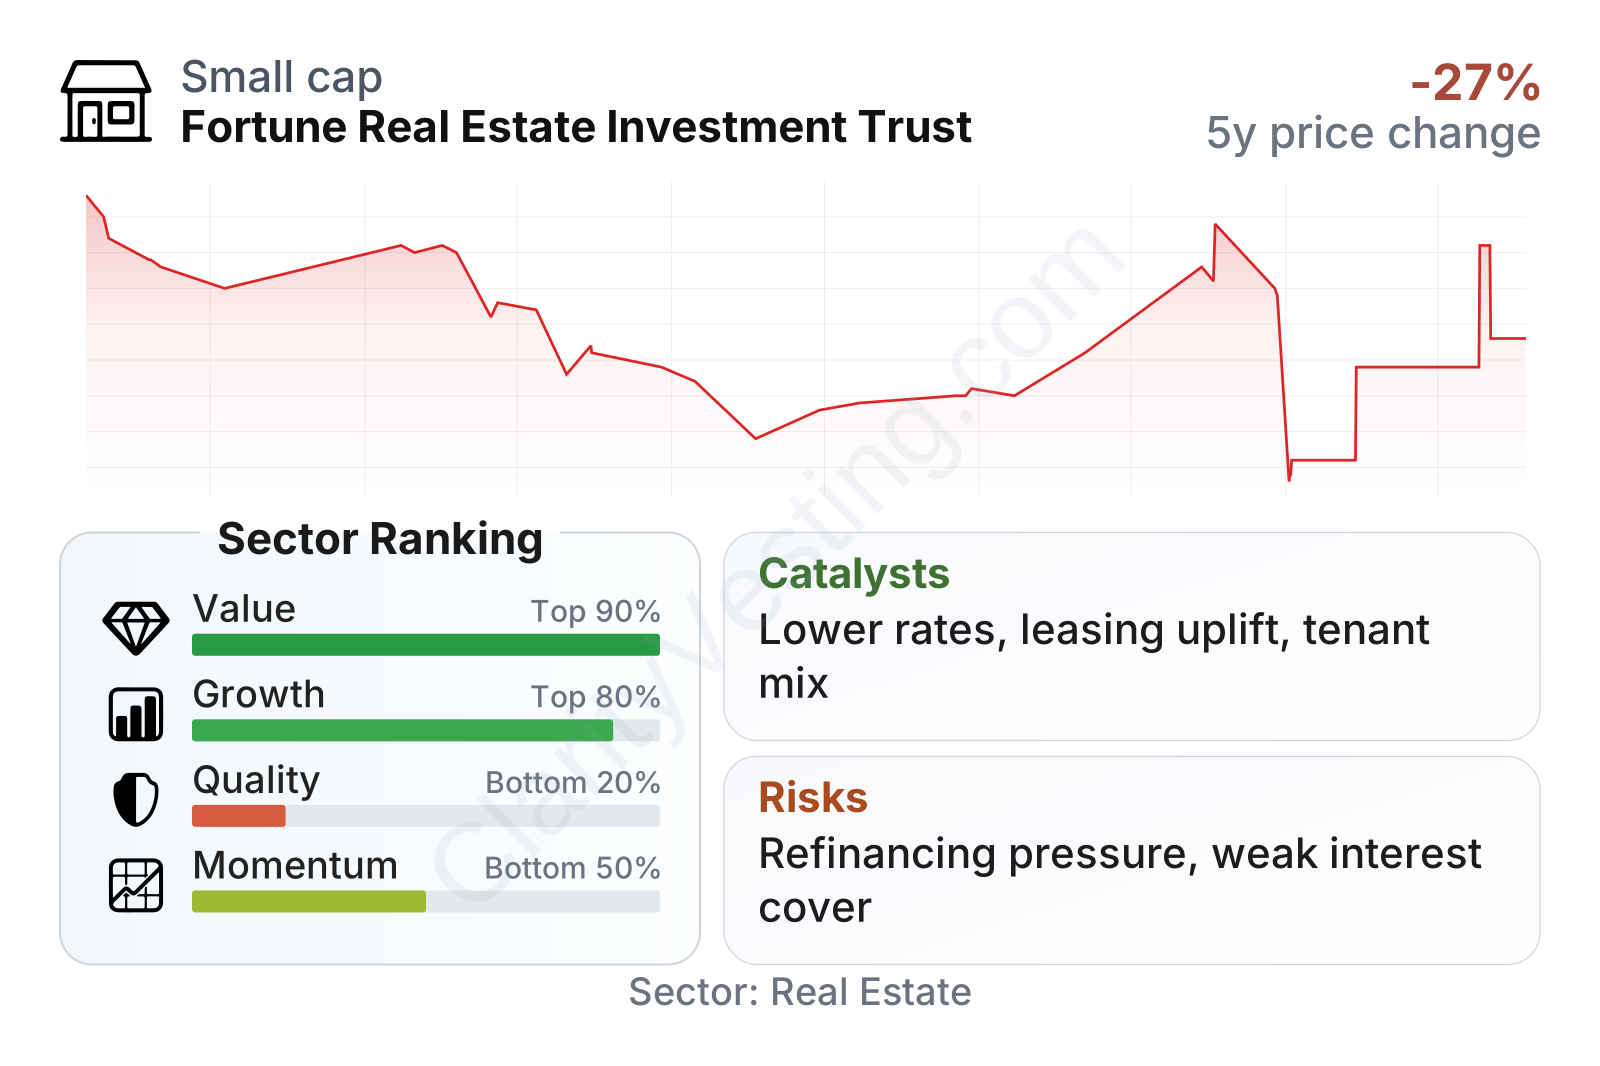
The broad picture is mixed. On valuation measures, the trust screens as extremely cheap relative to much of the real estate sector, especially on price-to-book and trailing yield metrics. Growth signals also look unusually strong over a five-year period on a per-share basis, but those numbers appear distorted by capital structure and accounting effects, so they should be handled carefully. The weak area is business quality: profitability is below sector norms, recent returns on equity and assets are negative, leverage is meaningful, and interest coverage is thin. Market momentum has improved recently, with the shares performing better than many peers over the past year, but the longer three-year share-price trend remains subdued.
Growth
Fortune REIT operates in a sector that should remain relevant over the long run, but it is not a high-growth corner of real estate. Neighborhood retail centers benefit from repeat traffic and daily-needs spending, which can make them steadier than discretionary retail assets. In dense urban markets like Hong Kong, well-located community malls can retain their usefulness for a long time because they sit close to residential catchments and transport links. That supports occupancy and rent resilience more than rapid expansion.
The trust’s strategy makes sense if the goal is stable cash generation rather than aggressive development. A landlord focused on necessity-led retail usually has a clearer path to preserving income than a landlord dependent on office demand or tourism-heavy luxury retail. If interest rates become less restrictive, that could help the company more than many operating businesses because lower funding pressure can flow through quickly to distributable income.
Revenue per share looks unusually strong over the latest multi-year view, but the annual revenue line itself has been relatively flat. That suggests the apparent growth is likely influenced by changes in units outstanding or reporting effects rather than a dramatic expansion of the underlying property base. For long-term analysis, the more important point is that the trust has preserved a sizable rental income stream despite a difficult retail and rate environment.
The distribution record is more volatile than the latest headline yield may suggest. Dividend per share fell from 2021 through 2024 before showing a very large jump in 2025, which likely reflects special factors rather than a simple step-change in normalized earning power. For a REIT, the key growth question is not just whether distributions rise in one year, but whether rents, occupancy, refinancing terms, and asset values can support them consistently over time.
A meaningful catalyst is the rate backdrop. Fortune REIT has been dealing with heavy interest expense, and any sustained improvement in borrowing conditions would have an outsized effect on earnings and distribution capacity. Another catalyst is leasing progress within its existing portfolio: small rental reversions, stronger occupancy, and better tenant mix can improve cash generation without requiring major acquisitions. Because the trust already owns established retail assets, incremental operating improvements matter more than large-scale expansion.
Recent company communications have also highlighted active asset management, tenant mix optimization, and capital management. Those are not dramatic growth engines, but for a mature retail REIT they are practical levers that can improve income quality and reduce pressure on distributions.
Risks
This article is for informational purposes only and does not constitute financial advice. Some content is AI-generated. See Disclaimer


