Stock Analysis · Fairfax Financial Holdings Ltd (FRFHF)
Overview
Fairfax Financial Holdings Ltd is a Canadian financial group best known for property and casualty insurance. In simple terms, it collects insurance premiums, invests that money until claims need to be paid, and also owns a collection of non-insurance businesses through subsidiaries and investments. The company operates globally, with meaningful exposure to North America, Asia, and other international markets.
Its business model has two main engines. The first is underwriting, which means writing insurance policies and trying to collect more in premiums than it pays out in claims and expenses over time. The second is investing, where Fairfax manages a large portfolio of bonds, stocks, and other assets supported by insurance float. This structure can be powerful when underwriting is disciplined and investment results are strong at the same time.
Based on recent annual reporting, Fairfax’s revenue mix is broadly led by insurance and reinsurance operations, with investment-related income and gains also playing a major role. Because insurers can have volatile reporting from market movements, the exact mix can shift from year to year, but the largest sources are generally:
- Gross premiums written and insurance revenue: the core business, representing the clear majority of operating activity. This includes property and casualty insurance, reinsurance, and specialty lines written through subsidiaries such as Odyssey Group, Crum & Forster, Zenith, Brit, and Allied World-related operations within the broader group structure over time.
- Interest and dividend income: income earned on Fairfax’s large investment portfolio, especially from bonds, short-term investments, and dividend-paying holdings.
- Net gains on investments: realized and unrealized gains or losses from common stocks, bonds, hedges, and other investment positions. This can materially lift or reduce reported earnings in any given period.
- Non-insurance revenue: sales and service revenue from consolidated non-insurance subsidiaries, which add diversification but are smaller than the insurance platform.
What stands out is that Fairfax is not a pure insurer in the narrow sense. It combines insurance operations with a value-oriented investment approach, which makes results more cyclical and sometimes less predictable than a straightforward insurer, but it also creates more ways to build long-term book value when management allocates capital well.
The long-term financial flow shows a business that has expanded revenue from the mid-$20 billions to about $30 billion over the last five years, while operating income and net income have generally improved despite normal volatility in insurance and investments.
Key Figures
| Metric | Value | Sector ⓘ |
|---|---|---|
| Date | Oct 03, 2026 | |
| Context | ||
| Sector | Financial Services | |
| Industry | Insurance - Property & Casualty | |
| Market Cap ⓘ | $32.50B | |
| Beta ⓘ | 0.43 | |
Value (Cheapness) | ||
| P/E Ratio ⓘ | 7.68 | 12.60 |
| P/B Ratio ⓘ | 1.12 | 1.23 |
| FCF Yield ⓘ | 0.08% | 10.16% |
| Dividend Yield ⓘ | 0.96% | 2.96% |
| EBIT / EV ⓘ | 18.58% | 7.77% |
| PEG ⓘ | 0.27 | |
Growth (Business expansion) | ||
| Revenue Growth ⓘ | -0.50% | 9.50% |
| RPS Growth (5Y CAGR) ⓘ | 3.46% | 12.10% |
| EPS Growth (5Y CAGR) ⓘ | -8.17% | -9.45% |
| BVPS Growth (5Y CAGR) ⓘ | 7.02% | 5.01% |
| Margin Growth (5Y Trend) ⓘ | 5.29% | -4.07% |
| FCF Growth (5Y CAGR) ⓘ | -21.43% | 4.96% |
| DPS Growth (5Y CAGR) ⓘ | 3.56% | 8.79% |
Quality (Business durability) | ||
| ROIC (Latest) ⓘ | 14.39% | 9.60% |
| ROE (Latest) ⓘ | 20.67% | 13.84% |
| ROA (Latest) ⓘ | 4.18% | 1.53% |
| ROIC (5Y Median) ⓘ | 17.81% | 7.86% |
| ROE (5Y Median) ⓘ | 22.20% | 12.20% |
| ROA (5Y Median) ⓘ | 4.23% | 1.29% |
| Net Debt / EBIT (Latest) ⓘ | 1.11 | 0.91 |
| Net Debt / EBIT (5Y Median) ⓘ | 0.43 | 0.74 |
| Net Debt / EBITDA (Latest) ⓘ | 1.02 | 0.97 |
| Operating Margin (Latest) ⓘ | 24.25% | 22.12% |
| Operating Margin (5Y Median) ⓘ | 24.30% | 24.39% |
| Debt to Equity (Latest) ⓘ | 54.38% | 60.37% |
| Profit Margin (Latest) ⓘ | 11.62% | 26.62% |
| Free Cash Flow (Latest) ⓘ | $25.51M | |
Momentum (Price trend) | ||
| 3Y Return ⓘ | +92.20% | +89.23% |
| 12M Return (excl. last month) ⓘ | -4.18% | +17.35% |
| 6M Return ⓘ | -8.27% | +10.00% |
| Price vs. 200-Day MA ⓘ | -7.84% | +3.73% |
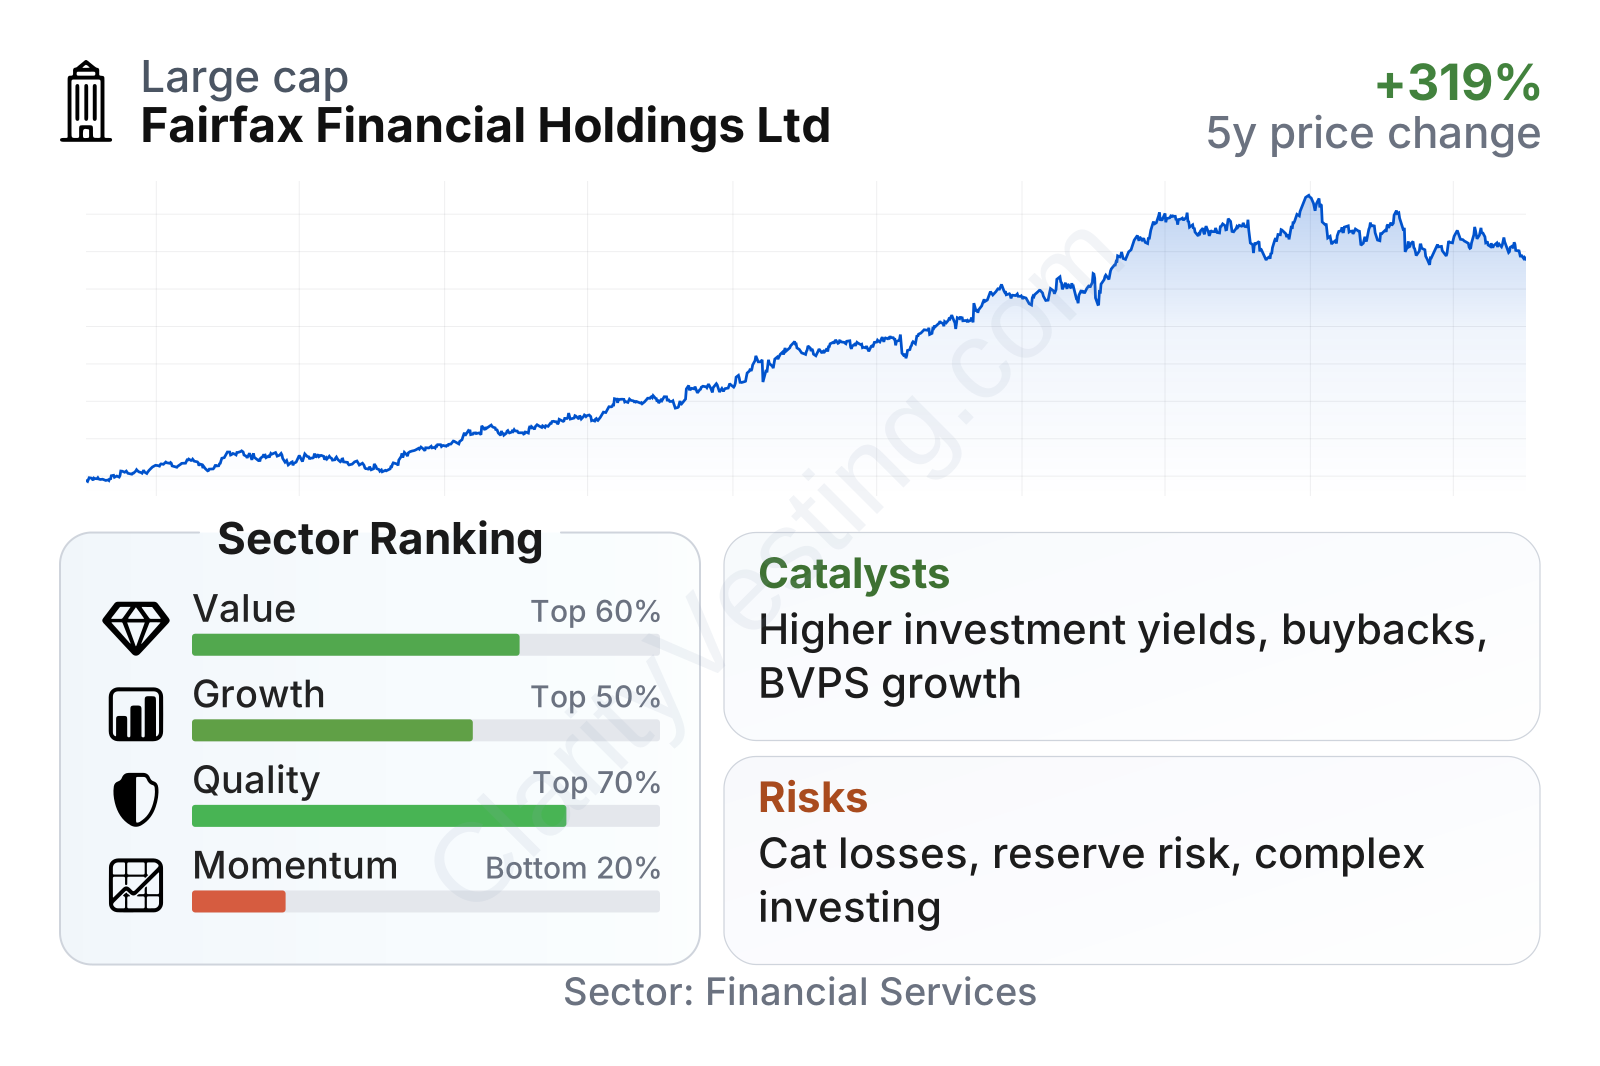
Fairfax is a large insurer by market value, and the share price trend over the last several years has been strong over the long run even though performance has cooled more recently. The latest factor snapshot points to a company with above-sector profitability and capital efficiency, moderate growth characteristics, weaker recent market momentum, and valuation multiples that remain below many peers on earnings and book value. Its low beta also suggests the stock has historically moved less than the broader market, although that does not remove the business volatility tied to catastrophes, reserving, or investment results.
Growth
Property and casualty insurance is a mature industry, but it is still a growing one. Premiums tend to rise over time because of inflation, higher insured values, economic activity, and periodic “hard markets” when insurers can raise prices after years of heavy losses. That matters for Fairfax because disciplined underwriting becomes especially attractive when pricing conditions are favorable. In recent years, the sector has also benefited from higher interest rates, which improve returns on insurers’ bond portfolios.
Fairfax’s strategy is coherent for long-term expansion because it does not rely on only one source of progress. It can grow through premium volume, better underwriting margins, reinvestment of insurance float at higher yields, bolt-on acquisitions, and appreciation in investments. That mix has helped book value per share compound at about 12% annually over the last five years, which is a meaningful sign of value creation for an insurer.
Earnings per share have been volatile, which is normal for a company with material investment exposure, but the broader direction has improved sharply since 2021. The pattern suggests that stronger underwriting and investment income have outweighed the swings that can come from market-sensitive holdings.
Book value per share is especially important for Fairfax because insurers are often judged on how effectively they grow the capital backing their policies and investments. Here, the trend has been clearly positive, moving from the mid-$700s to above $1,100 over the period shown. That is one of the more compelling indicators in the company’s profile.
Recent company updates have also highlighted ongoing share repurchases and continued emphasis on underwriting profitability and investment income. For a business trading around book value rather than at a large premium, repurchases can matter if management believes shares are below intrinsic worth. Another practical catalyst is the reinvestment of fixed-income assets at yields that are higher than what insurers were able to earn during the near-zero-rate years.
Risks
This article is for informational purposes only and does not constitute financial advice. Some content is AI-generated. See Disclaimer


