Stock Analysis · FRBP (FRBP)
Overview
FRBP operates in financial services and is classified in asset management, but its current business mix is more specialized than a traditional fee-based asset manager. Public filings show the company is tied primarily to mortgage banking and related financial activities through First Guaranty Bancshares and First Guaranty Mortgage Corporation, with earnings influenced by loan production, sales into the secondary market, servicing-related activity, and the financing costs attached to those operations.
That matters because FRBP’s results are shaped less by the steady, recurring fee streams usually associated with large diversified asset managers and more by credit, funding, and housing-market conditions. In simple terms, the company makes money when it can originate or handle mortgage-related assets profitably, manage those assets efficiently, and control the cost of the debt used to fund the business.
Reliable public disclosures do not provide a clean, current 2026 segment split with precise percentages by revenue source in the same way that many larger financial firms do. Based on the company’s filings and the structure of the business, the main economic drivers appear to be:
- Mortgage banking revenue — income tied to originating residential mortgages and selling loans or loan-related rights into the market.
- Interest income and spread-related earnings — revenue generated from financial assets held on balance sheet, offset by substantial financing costs.
- Servicing and related fees — income connected to the ongoing administration of mortgage loans and ancillary financial services.
- Other financial and investment activity — smaller contributions that can include fair-value changes, fees, or other non-core items depending on the reporting period.
The broad financial flow has improved sharply over the last few years. Revenue expanded from roughly $28 million in 2022 to about $157 million in 2025, and net income also increased materially. At the same time, interest expense rose very quickly, which is a reminder that growth has come with a heavier funding burden.
The visual summary highlights a company that has scaled up fast, with revenue and earnings rising strongly since 2022. The main counterweight is the surge in interest expense, which has grown almost as quickly as the business itself and now plays a major role in profitability.
Key Figures
| Metric | Value | Sector ⓘ |
|---|---|---|
| Date | Oct 24, 2026 | |
| Context | ||
| Sector | Financial Services | |
| Industry | Asset Management | |
| Market Cap ⓘ | $1.37B | |
| Beta ⓘ | N/A | |
Value (Cheapness) | ||
| P/E Ratio ⓘ | 14.64 | 12.46 |
| P/B Ratio ⓘ | 0.56 | 1.25 |
| FCF Yield ⓘ | 9.54% | 9.82% |
| Dividend Yield ⓘ | N/A | 2.94% |
| EBIT / EV ⓘ | N/A | 8.11% |
| PEG ⓘ | N/A | |
Growth (Business expansion) | ||
| Revenue Growth ⓘ | N/A | 9.10% |
| RPS Growth (5Y CAGR) ⓘ | 73.89% | 12.31% |
| EPS Growth (5Y CAGR) ⓘ | -35.68% | -6.97% |
| BVPS Growth (5Y CAGR) ⓘ | 117.92% | 5.02% |
| Margin Growth (5Y Trend) ⓘ | N/A | -4.00% |
| FCF Growth (5Y CAGR) ⓘ | N/A | 4.71% |
| DPS Growth (5Y CAGR) ⓘ | 89.11% | 8.92% |
Quality (Business durability) | ||
| ROIC (Latest) ⓘ | N/A | 9.18% |
| ROE (Latest) ⓘ | 5.41% | 13.93% |
| ROA (Latest) ⓘ | 2.32% | 1.57% |
| ROIC (5Y Median) ⓘ | N/A | 7.80% |
| ROE (5Y Median) ⓘ | N/A | 12.15% |
| ROA (5Y Median) ⓘ | N/A | 1.28% |
| Net Debt / EBIT (Latest) ⓘ | N/A | 1.02 |
| Net Debt / EBIT (5Y Median) ⓘ | N/A | 0.72 |
| Net Debt / EBITDA (Latest) ⓘ | N/A | 0.88 |
| Operating Margin (Latest) ⓘ | N/A | 22.30% |
| Operating Margin (5Y Median) ⓘ | N/A | 24.50% |
| Debt to Equity (Latest) ⓘ | N/A | 59.34% |
| Profit Margin (Latest) ⓘ | N/A | 26.42% |
| Free Cash Flow (Latest) ⓘ | $130.83M | |
Momentum (Price trend) | ||
| 3Y Return ⓘ | N/A | +95.73% |
| 12M Return (excl. last month) ⓘ | -10.44% | +17.30% |
| 6M Return ⓘ | -14.16% | +6.07% |
| Price vs. 200-Day MA ⓘ | -10.03% | +5.36% |
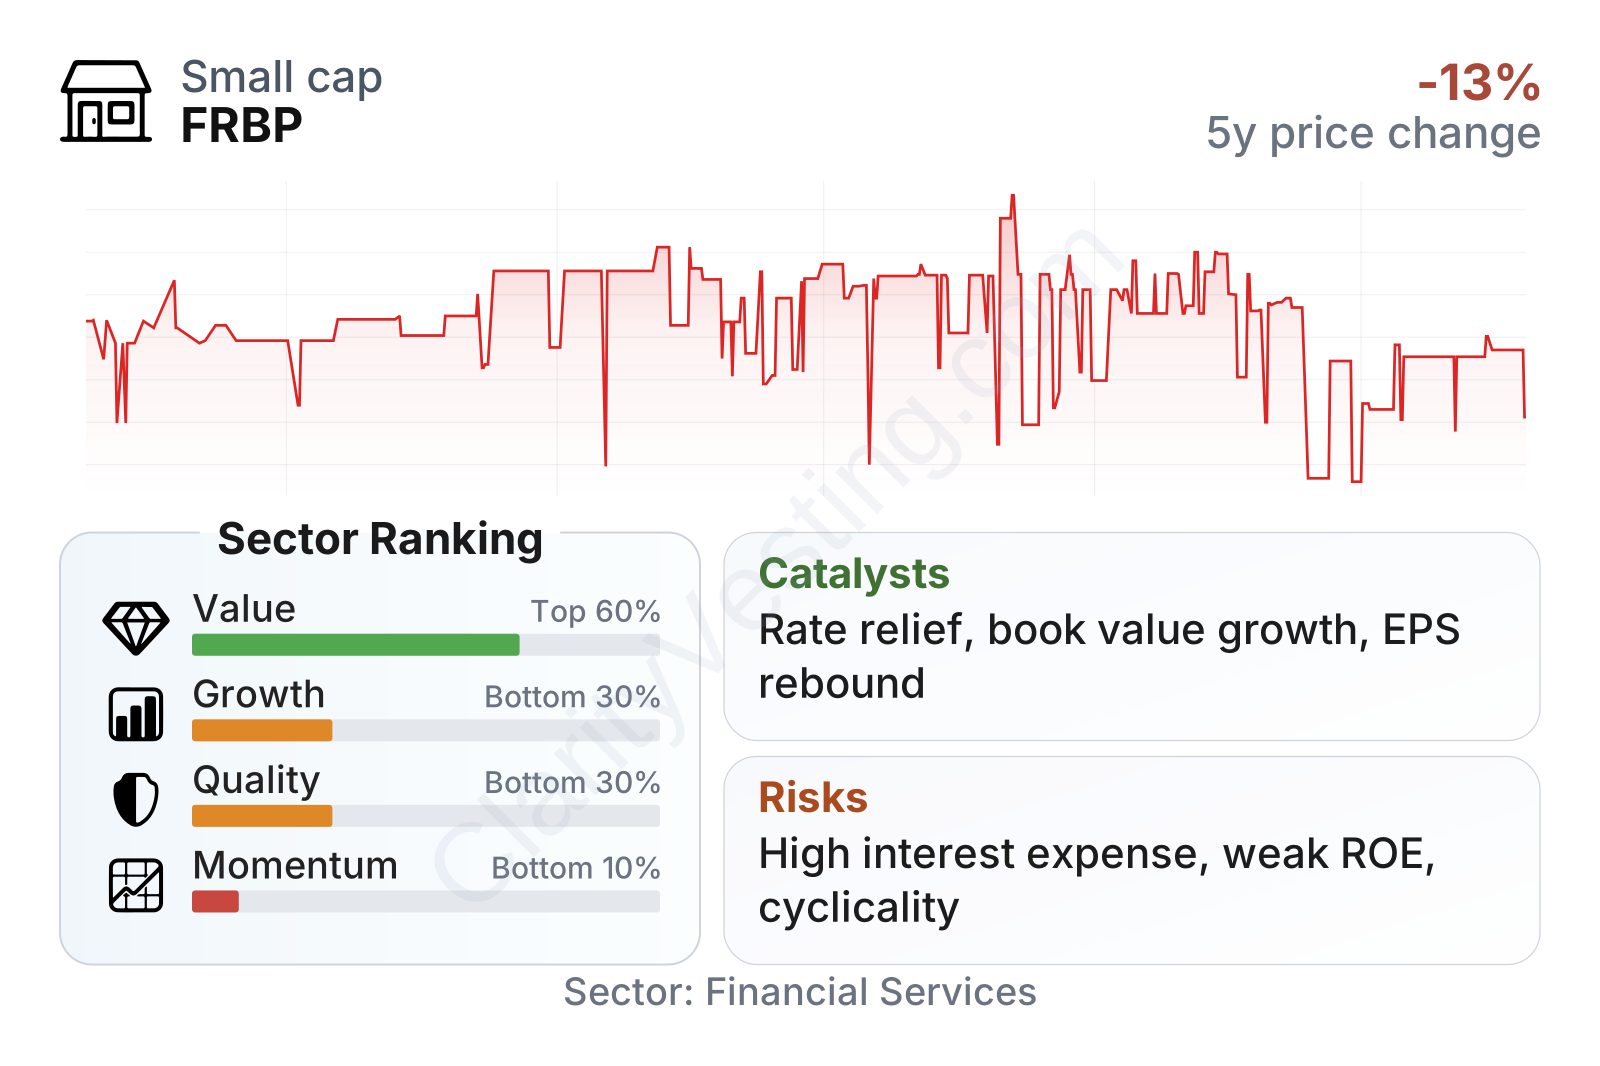
FRBP is a small-cap financial company, which usually means more room for business shifts—both positive and negative—than at larger peers. The recent share price has been fairly range-bound, with weakness over the last 6 to 12 months rather than a strong upward trend.
The metrics table paints a mixed picture. On valuation, the stock trades at a price-to-book ratio well below the sector median, while the price-to-earnings ratio sits closer to the sector range than the low price-to-book might suggest. Free cash flow generation is meaningful in absolute terms, but the company does not currently screen as strong on quality, growth, or momentum relative to most financial peers.
One unusual feature is the gap between long-term balance-sheet growth and weaker earnings growth. Book value and revenue per share have expanded dramatically over five years, but earnings per share over that same period have been much less consistent. That combination often signals a business that has grown rapidly through a balance-sheet-heavy model rather than through stable, compounding profitability.
Growth
FRBP is exposed to a sector that can grow over time, but not in a straight line. Housing finance, mortgage servicing, and related specialty financial activities benefit from long-term demand for home financing, refinancing cycles, and secondary-market activity. However, this is a highly cyclical area, and growth depends heavily on interest rates, borrower demand, and access to funding.
The company’s strategy appears to be built around scaling its mortgage and financial asset platform. The sharp increase in revenue and book value over recent years suggests management has been expanding the balance sheet and the operating base aggressively. If that expansion can be maintained while financing costs stabilize, the model has room to produce stronger earnings.
The earnings pattern supports that idea, but only partially. Earnings per share improved from 2024 to 2025, showing that the larger platform can generate more profit when conditions cooperate. Still, the more recent trailing figure suggests that the pace is not smooth, which is typical for businesses tied closely to mortgage spreads and market conditions.
Book value per share remains one of the more notable growth indicators here. It jumped sharply between 2023 and 2024 and stayed elevated in 2025, indicating that the company built substantial shareholder equity over a short period. For financial firms, book value matters because it represents the capital base that can support future activity. A rising book value can be an important signal when it comes from durable asset growth rather than short-lived accounting effects.
A practical catalyst would be any easing in funding pressure or a more favorable mortgage environment. If loan production, servicing economics, or asset values improve while interest expense stops rising so quickly, earnings could benefit disproportionately. In addition, the current valuation leaves room for the market to re-rate the stock if the company proves that recent growth is sustainable rather than temporary.
Risks
This article is for informational purposes only and does not constitute financial advice. Some content is AI-generated. See Disclaimer


