Stock Analysis · Forgent Power Solutions Inc (FPS)
Overview
Forgent Power Solutions Inc operates in electrical equipment and power-related industrial products. In simple terms, the company sells equipment and systems used to distribute, control, protect, and manage electrical power. Businesses in this part of the market usually benefit from long-cycle spending tied to grid upgrades, industrial electrification, commercial construction, backup power, and energy infrastructure modernization.
Based on the company’s recent financial profile, Forgent appears to be in a rapid scale-up phase. Revenue expanded sharply over the last two fiscal years, while operating income and net income moved from losses to positive territory. That suggests the business is not only getting bigger, but also becoming more efficient at turning sales into profit.
Publicly available segment detail for 2026 is limited in the material reviewed, so a precise revenue split by product line is not available here. At a high level, the company’s revenue likely comes from a mix of the following activities within electrical equipment and parts:
- Power distribution and control equipment — switchgear, panels, protection systems, and related hardware used to route and manage electricity.
- Electrical components and parts — products sold into industrial, utility, commercial, and infrastructure applications.
- System integration and project-related sales — higher-value solutions that can include engineering, configuration, and deployment tied to customer projects.
- Aftermarket and service-related activity — maintenance, replacement parts, and support, if applicable within its operating model.
The most visible business trend is the jump in scale. Revenue rose from about $181 million in fiscal 2024 to roughly $753 million in fiscal 2025 and then to about $1.42 billion in fiscal 2026. Gross profit also increased substantially, and operating income improved from negative territory in 2024 to a solid positive level by 2026. That kind of progression usually points to either strong end-market demand, successful acquisitions, or both.
The income flow shows a clear improvement in operating leverage. Gross profit has grown strongly, and operating income has expanded much faster than sales over the last two years. The main drag lower down the income statement is interest expense, which remains meaningful and explains why net profit has improved more slowly than operating profit.
Key Figures
| Metric | Value | Sector ⓘ |
|---|---|---|
| Date | Oct 24, 2026 | |
| Context | ||
| Sector | Industrials | |
| Industry | Electrical Equipment & Parts | |
| Market Cap ⓘ | $9.64B | |
| Beta ⓘ | N/A | |
Value (Cheapness) | ||
| P/E Ratio ⓘ | 100.77 | 22.29 |
| P/B Ratio ⓘ | 21.15 | 1.98 |
| FCF Yield ⓘ | -0.28% | 6.26% |
| Dividend Yield ⓘ | N/A | 1.92% |
| EBIT / EV ⓘ | 1.60% | 4.83% |
| PEG ⓘ | 0.41 | |
Growth (Business expansion) | ||
| Revenue Growth ⓘ | 94.30% | 9.30% |
| RPS Growth (5Y CAGR) ⓘ | 143.85% | 7.76% |
| EPS Growth (5Y CAGR) ⓘ | N/A | -13.17% |
| BVPS Growth (5Y CAGR) ⓘ | -11.53% | 6.13% |
| Margin Growth (5Y Trend) ⓘ | 14.82% | 0.74% |
| FCF Growth (5Y CAGR) ⓘ | N/A | 10.79% |
| DPS Growth (5Y CAGR) ⓘ | N/A | 9.41% |
Quality (Business durability) | ||
| ROIC (Latest) ⓘ | 15.12% | 10.75% |
| ROA (Latest) ⓘ | 4.27% | 5.41% |
| ROIC (5Y Median) ⓘ | N/A | 9.37% |
| ROA (5Y Median) ⓘ | N/A | 4.95% |
| Net Debt / EBIT (Latest) ⓘ | 3.15 | 2.04 |
| Net Debt / EBIT (5Y Median) ⓘ | N/A | 2.27 |
| Net Debt / EBITDA (Latest) ⓘ | 2.44 | 1.39 |
| Net Debt / Assets ⓘ | 25.89% | 19.27% |
| EBITDA / Interest ⓘ | 4.17 | 9.58 |
| Operating Margin (Latest) ⓘ | 12.99% | 10.49% |
| Operating Margin (5Y Median) ⓘ | 10.30% | 10.30% |
| Debt to Equity (Latest) ⓘ | 124.71% | 64.82% |
| Profit Margin (Latest) ⓘ | 5.76% | 6.67% |
| Free Cash Flow (Latest) ⓘ | -$27.01M | |
Momentum (Price trend) | ||
| 3Y Return ⓘ | N/A | +67.77% |
| 12M Return (excl. last month) ⓘ | N/A | +12.05% |
| 6M Return ⓘ | -6.75% | 0.00% |
| Price vs. 200-Day MA ⓘ | N/A | +0.67% |
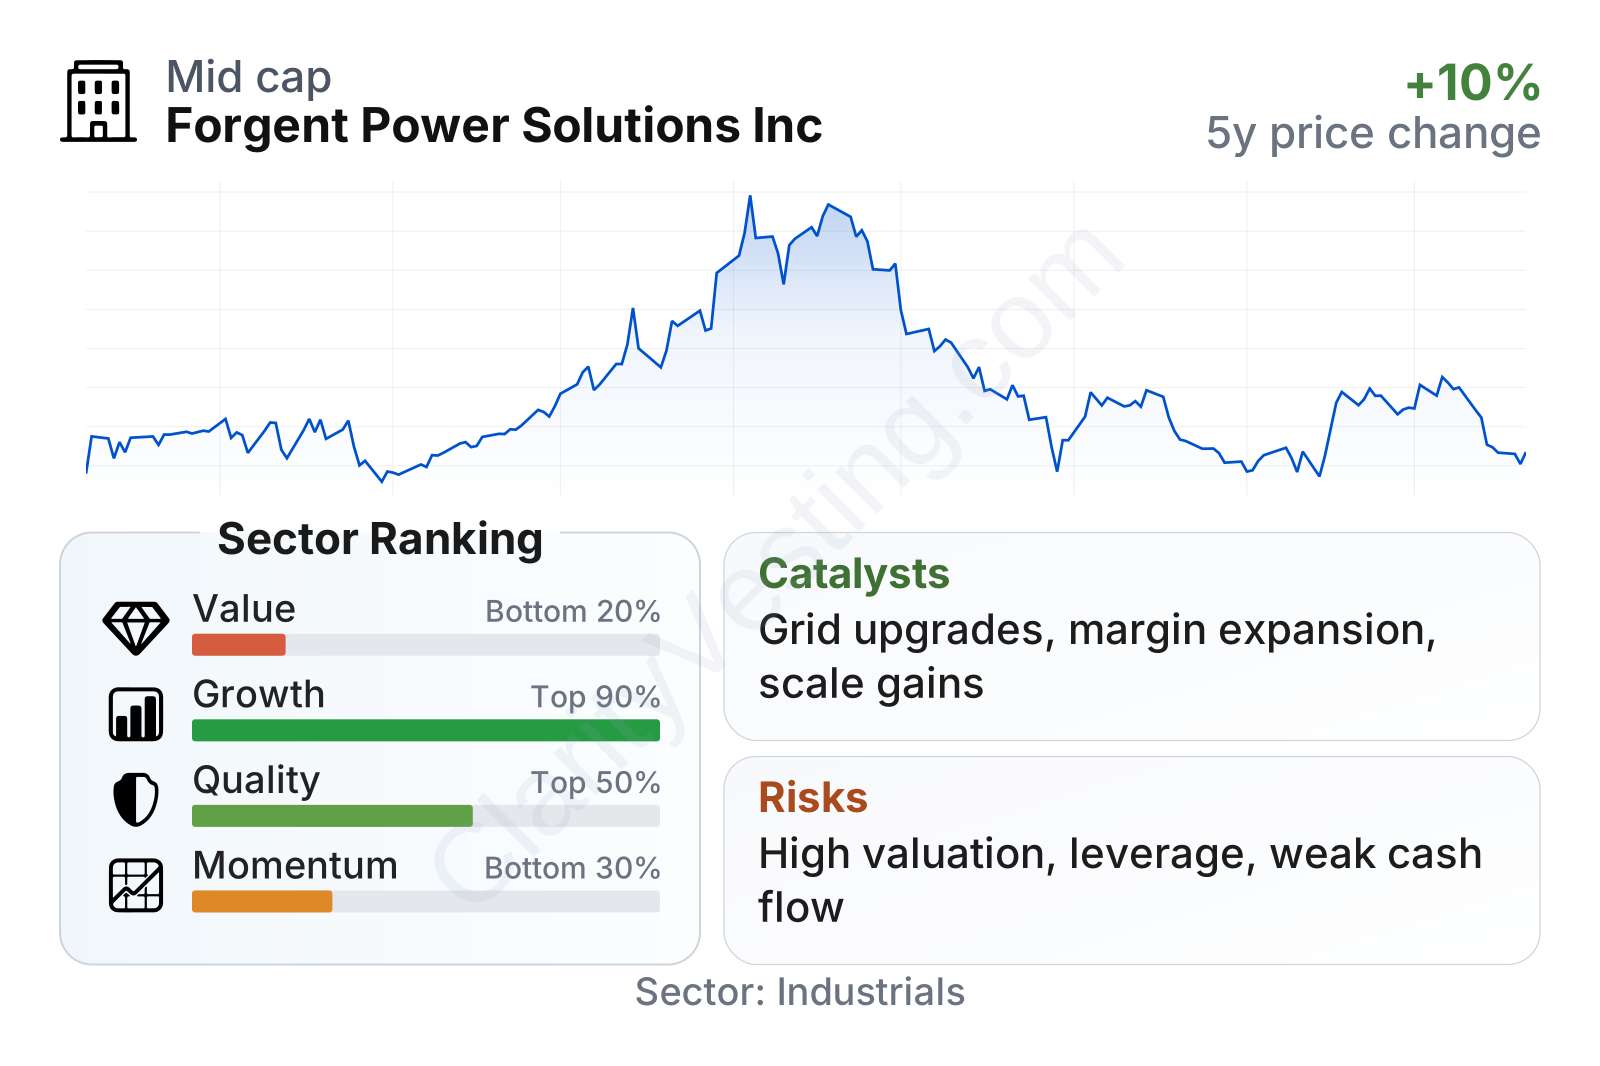
Forgent stands out for very strong growth and better-than-sector operating profitability, but the valuation is demanding. Revenue growth is far above the sector median, and operating margins are now running modestly above the industry midpoint. At the same time, the stock trades at much higher earnings and book-value multiples than most peers, while free cash flow remains negative. That combination signals a market that is already pricing in continued expansion and further execution progress.
The stock has also shown solid recent momentum, with gains over the last six months that are stronger than the typical industrial name in its sector. Still, the balance sheet metrics are less comfortable than the growth metrics: leverage is elevated, interest coverage is below the sector median, and debt remains a meaningful part of the equity case.
Growth
Forgent operates in a favorable long-term environment. The electrical equipment industry is supported by several durable trends: electrification of industrial processes, utility network upgrades, data center power needs, renewable energy interconnection, and the broader push to make power systems more resilient. These are not short-lived themes, and they tend to support demand for the kinds of products sold by companies in this category.
The company’s recent trajectory suggests its strategy is aligned with those trends. Revenue growth of roughly 94% year over year is exceptional for an industrial company, and the five-year revenue-per-share growth rate is also far above the sector median. Just as important, operating margin trends over five years are notably stronger than the industry norm, which indicates that expansion has not come only from chasing volume at weak economics.
A potentially important catalyst is the move from subscale operations to a larger platform. Once industrial manufacturers reach greater scale, they can often spread overhead across a broader revenue base, negotiate procurement more effectively, and win larger contracts. Forgent’s jump in operating income over the last two fiscal years fits that pattern. If this is supported by a stronger order pipeline or project mix, future earnings power could continue to improve faster than revenue.
Another positive signal is that the company has already crossed from operating losses into profitability. That shift matters because it changes how the market evaluates future growth: investors often become more willing to pay premium multiples for companies that are proving they can scale profitably rather than simply grow sales.
Recent market performance also hints that the company’s progress has been recognized. The stock moved materially higher between February and May 2026 and has held most of that improvement. That does not prove fundamentals on its own, but it is consistent with stronger expectations around execution, demand, or earnings capacity.
Risks
This article is for informational purposes only and does not constitute financial advice. Some content is AI-generated. See Disclaimer