Stock Analysis · Federal National Mortgage Association (FNMFO)
Overview
Federal National Mortgage Association, better known as Fannie Mae, is one of the central institutions in the U.S. housing finance system. It does not usually lend directly to homebuyers. Instead, it buys mortgages from lenders, packages many of those loans into mortgage-backed securities, and guarantees investors that principal and interest will be paid even if borrowers default. This process helps banks and mortgage companies free up capital so they can make more home loans.
Its business is concentrated in mortgage finance, but the underlying economics come from several distinct sources. Based on recent annual reporting, the largest revenue drivers are tied to the size of its mortgage book and the spread between what it earns on mortgage assets and what it pays to fund them.
- Net interest income and guaranty-related income: approximately 80% to 90% of total revenue in recent periods. This includes interest earned on mortgage loans and mortgage-backed securities, plus guaranty fees charged for assuming credit risk on single-family and multifamily mortgages.
- Fair value gains and other market-related income: approximately 10% to 20%, but this can swing sharply from year to year. It mainly reflects valuation changes on derivatives and certain financial instruments used to manage interest-rate exposure.
- Fee and miscellaneous income: typically a low-single-digit share of total revenue. This includes smaller servicing, administrative, and other operating items.
Operationally, Fannie Mae is dominated by its single-family business, which is the largest contributor to guaranty fees and credit performance, while the multifamily segment is smaller but still important because it finances apartment and rental housing properties. Recent results also show a business with very high gross profitability, but one where reported earnings can move around because interest expense and fair-value accounting effects are substantial.
The bigger point for long-term analysis is that Fannie Mae is not a typical bank and not a typical insurer. Its role is deeply linked to national housing policy, mortgage rates, and the rules set by its federal conservator.
Over the past several years, total revenue has trended upward, while net income has remained profitable but more uneven. Interest expense has also risen materially, which matters because funding costs can pressure returns even when mortgage activity stays healthy.
Key Figures
| Metric | Value | Sector ⓘ |
|---|---|---|
| Date | Oct 10, 2026 | |
| Context | ||
| Sector | Financial Services | |
| Industry | Mortgage Finance | |
| Market Cap ⓘ | $15.19B | |
| Beta ⓘ | 1.69 | |
Value (Cheapness) | ||
| P/E Ratio ⓘ | N/A | 12.38 |
| P/B Ratio ⓘ | 1,264.62 | 1.23 |
| FCF Yield ⓘ | 201.81% | 10.23% |
| Dividend Yield ⓘ | N/A | 3.01% |
| EBIT / EV ⓘ | N/A | 8.08% |
| PEG ⓘ | N/A | |
Growth (Business expansion) | ||
| Revenue Growth ⓘ | 9.10% | 9.50% |
| RPS Growth (5Y CAGR) ⓘ | 0.08% | 12.21% |
| EPS Growth (5Y CAGR) ⓘ | N/A | -9.62% |
| BVPS Growth (5Y CAGR) ⓘ | -6.66% | 4.98% |
| Margin Growth (5Y Trend) ⓘ | -78.98% | -4.07% |
| FCF Growth (5Y CAGR) ⓘ | -15.57% | 4.76% |
| DPS Growth (5Y CAGR) ⓘ | N/A | 8.79% |
Quality (Business durability) | ||
| ROIC (Latest) ⓘ | N/A | 9.35% |
| ROE (Latest) ⓘ | 13.59% | 13.91% |
| ROA (Latest) ⓘ | 0.35% | 1.53% |
| ROIC (5Y Median) ⓘ | 0.56% | 7.86% |
| ROE (5Y Median) ⓘ | 14.11% | 12.22% |
| ROA (5Y Median) ⓘ | 0.39% | 1.29% |
| Net Debt / EBIT (Latest) ⓘ | N/A | 0.99 |
| Net Debt / EBIT (5Y Median) ⓘ | 147.26 | 0.73 |
| Net Debt / EBITDA (Latest) ⓘ | 35.50 | 0.93 |
| Operating Margin (Latest) ⓘ | N/A | 22.19% |
| Operating Margin (5Y Median) ⓘ | 88.85% | 24.30% |
| Debt to Equity (Latest) ⓘ | 3595.16% | 60.24% |
| Profit Margin (Latest) ⓘ | 54.27% | 26.49% |
| Free Cash Flow (Latest) ⓘ | $30.65B | |
Momentum (Price trend) | ||
| 3Y Return ⓘ | +331.03% | +88.52% |
| 12M Return (excl. last month) ⓘ | -41.28% | +19.65% |
| 6M Return ⓘ | -40.48% | +6.00% |
| Price vs. 200-Day MA ⓘ | -35.64% | +3.61% |
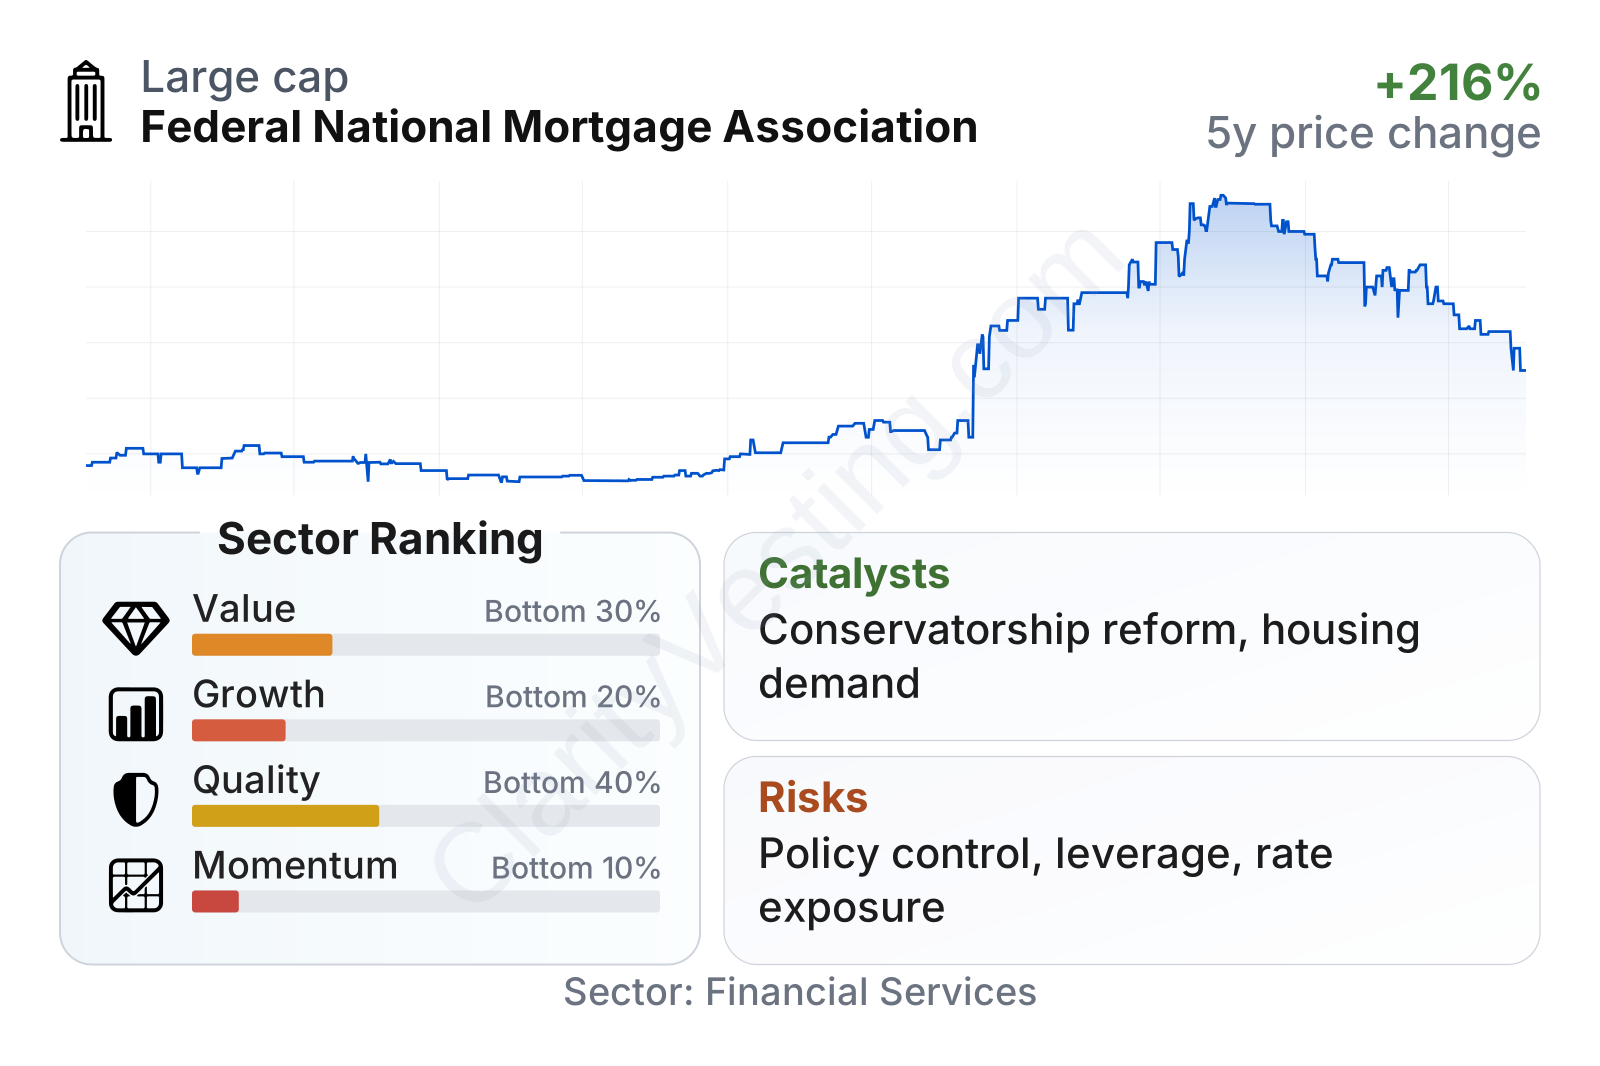
Fannie Mae sits in a very unusual position on the metrics table. Profitability remains meaningful, with return on equity around the sector median and profit margin well above it, but balance-sheet leverage is extraordinarily high compared with most financial companies. Growth indicators are weak relative to the broader sector, especially over five years, and recent share-price momentum has been negative despite very strong gains over a longer three-year window. The result is a company that looks profitable on current earnings, but structurally difficult to compare with ordinary financial stocks because of its capital framework and conservatorship status.
Growth
Fannie Mae operates in a sector that should remain important for decades: U.S. housing finance. The long-term demand backdrop is supported by population needs, limited housing supply in many markets, and the central role of the 30-year fixed-rate mortgage in the United States. Those are durable industry foundations, even though yearly mortgage volumes can rise and fall sharply with interest rates.
Its strategy for future growth is less about geographic expansion or new product categories and more about maintaining scale in conforming mortgages, improving credit risk management, supporting lender liquidity, and expanding technology that makes mortgage underwriting and securitization more efficient. In that sense, the strategy is coherent: Fannie Mae already has nationwide reach, so execution matters more than expansion.
A major long-term catalyst is the possibility of changes to its conservatorship framework and capital structure. Since the 2008 financial crisis, Fannie Mae has operated under federal conservatorship. Any credible path toward a revised capital regime, a restructuring of government support, or a clearer status for common and preferred equity could materially change how the market values the company. This is one of the main reasons the stock has shown unusually large swings.
Another supportive factor is that higher mortgage rates do not only create headwinds. They can also widen guaranty-fee economics in some periods and reinforce the need for secondary-market liquidity, especially when private capital retreats. Multifamily housing finance is another area with structural relevance because rental housing remains a major need across the country.
On the other hand, the company’s growth profile is not broadly strong by standard public-equity measures. Recent year-over-year revenue growth has been close to the sector median, but five-year revenue-per-share growth has been near flat, and book value per share has been volatile.
The book value trend highlights how sensitive this business can be to accounting marks, capital policy, and balance-sheet conditions. Book value rose sharply through 2023, then dropped significantly in 2024 before stabilizing somewhat. That kind of movement matters because book value is a core anchor for financial companies, yet here it has been far less steady than at many banks or insurers.
Recent public developments also matter. Fannie Mae continues to operate under oversight from the Federal Housing Finance Agency, with ongoing focus on capital retention, credit standards, affordability goals, and risk-transfer practices. Those themes can create meaningful opportunities if the housing market remains functional and policy stays supportive of the government-sponsored model.
Risks
This article is for informational purposes only and does not constitute financial advice. Some content is AI-generated. See Disclaimer