Stock Analysis · Fraser and Neave Ltd (FNEVY)
Overview
Fraser and Neave Ltd is a Southeast Asian consumer company focused mainly on beverages and food. Its products are sold across categories such as soft drinks, dairy, juices, isotonic drinks, tea, coffee, condensed and evaporated milk, and ice cream. The group is best known through its consumer brands in Singapore, Malaysia, Thailand, and surrounding markets. It also has a printing and publishing operation, but this is a much smaller part of the business than food and beverage.
The company’s revenue is largely tied to everyday consumer demand, which gives it a relatively defensive profile compared with more cyclical industries. Based on recent annual reporting, the business mix is centered on food and beverage, with the rest coming from publishing and printing.
- Food & Beverage: approximately 98% of revenue. This includes dairies, soft drinks, beer distribution in some markets, ready-to-drink beverages, snacks, and ice cream.
- Printing & Publishing: approximately 2% of revenue. This includes book publishing, printing, and related services.
Within food and beverage, the largest contribution comes from beverage and dairy products sold through retail and distribution channels in ASEAN markets. That concentration means the company is closely linked to regional household consumption, brand strength, and raw material cost control.
Over the last few years, revenue has moved steadily higher and operating profit has also improved, showing that growth has not come only from higher sales volume but also from a better gross profit base. The business remains medium-sized by global consumer staples standards, but it has a strong local presence in several categories.
The revenue flow shows a business with improving scale: sales have risen from roughly $2.0 billion to more than $2.3 billion over four years, while gross profit and operating income also trended upward. Net income has been less smooth than operating profit, suggesting that financing costs and taxes still matter for the final result.
Key Figures
| Metric | Value | Sector ⓘ |
|---|---|---|
| Date | Oct 17, 2026 | |
| Context | ||
| Sector | Consumer Defensive | |
| Industry | Packaged Foods | |
| Market Cap ⓘ | $1.51B | |
| Beta ⓘ | 0.19 | |
Value (Cheapness) | ||
| P/E Ratio ⓘ | 13.68 | 17.88 |
| P/B Ratio ⓘ | 2.96 | 1.29 |
| FCF Yield ⓘ | 21.26% | 12.39% |
| Dividend Yield ⓘ | 2.57% | 2.85% |
| EBIT / EV ⓘ | N/A | 6.43% |
| PEG ⓘ | N/A | |
Growth (Business expansion) | ||
| Revenue Growth ⓘ | -5.10% | 4.10% |
| RPS Growth (5Y CAGR) ⓘ | 5.37% | 6.18% |
| EPS Growth (5Y CAGR) ⓘ | -16.74% | -13.59% |
| BVPS Growth (5Y CAGR) ⓘ | -7.43% | 3.20% |
| Margin Growth (5Y Trend) ⓘ | -0.33% | -0.15% |
| FCF Growth (5Y CAGR) ⓘ | N/A | 4.10% |
| DPS Growth (5Y CAGR) ⓘ | 2.42% | 6.79% |
Quality (Business durability) | ||
| ROIC (Latest) ⓘ | N/A | 12.34% |
| ROA (Latest) ⓘ | N/A | 6.30% |
| ROIC (5Y Median) ⓘ | 5.88% | 10.49% |
| ROA (5Y Median) ⓘ | 2.76% | 5.44% |
| Net Debt / EBIT (Latest) ⓘ | 3.25 | 1.96 |
| Net Debt / EBIT (5Y Median) ⓘ | 2.32 | 2.35 |
| Net Debt / EBITDA (Latest) ⓘ | 2.53 | 1.38 |
| Net Debt / Assets ⓘ | 18.98% | 21.51% |
| EBITDA / Interest ⓘ | N/A | 9.46 |
| Operating Margin (Latest) ⓘ | 13.70% | 8.87% |
| Operating Margin (5Y Median) ⓘ | 13.26% | 9.53% |
| Debt to Equity (Latest) ⓘ | N/A | 72.35% |
| Profit Margin (Latest) ⓘ | 6.93% | 5.40% |
| Free Cash Flow (Latest) ⓘ | $321.54M | |
Momentum (Price trend) | ||
| 3Y Return ⓘ | +29.83% | +20.92% |
| 12M Return (excl. last month) ⓘ | +1.32% | +2.13% |
| 6M Return ⓘ | +1.32% | +1.26% |
| Price vs. 200-Day MA ⓘ | +0.65% | +1.39% |
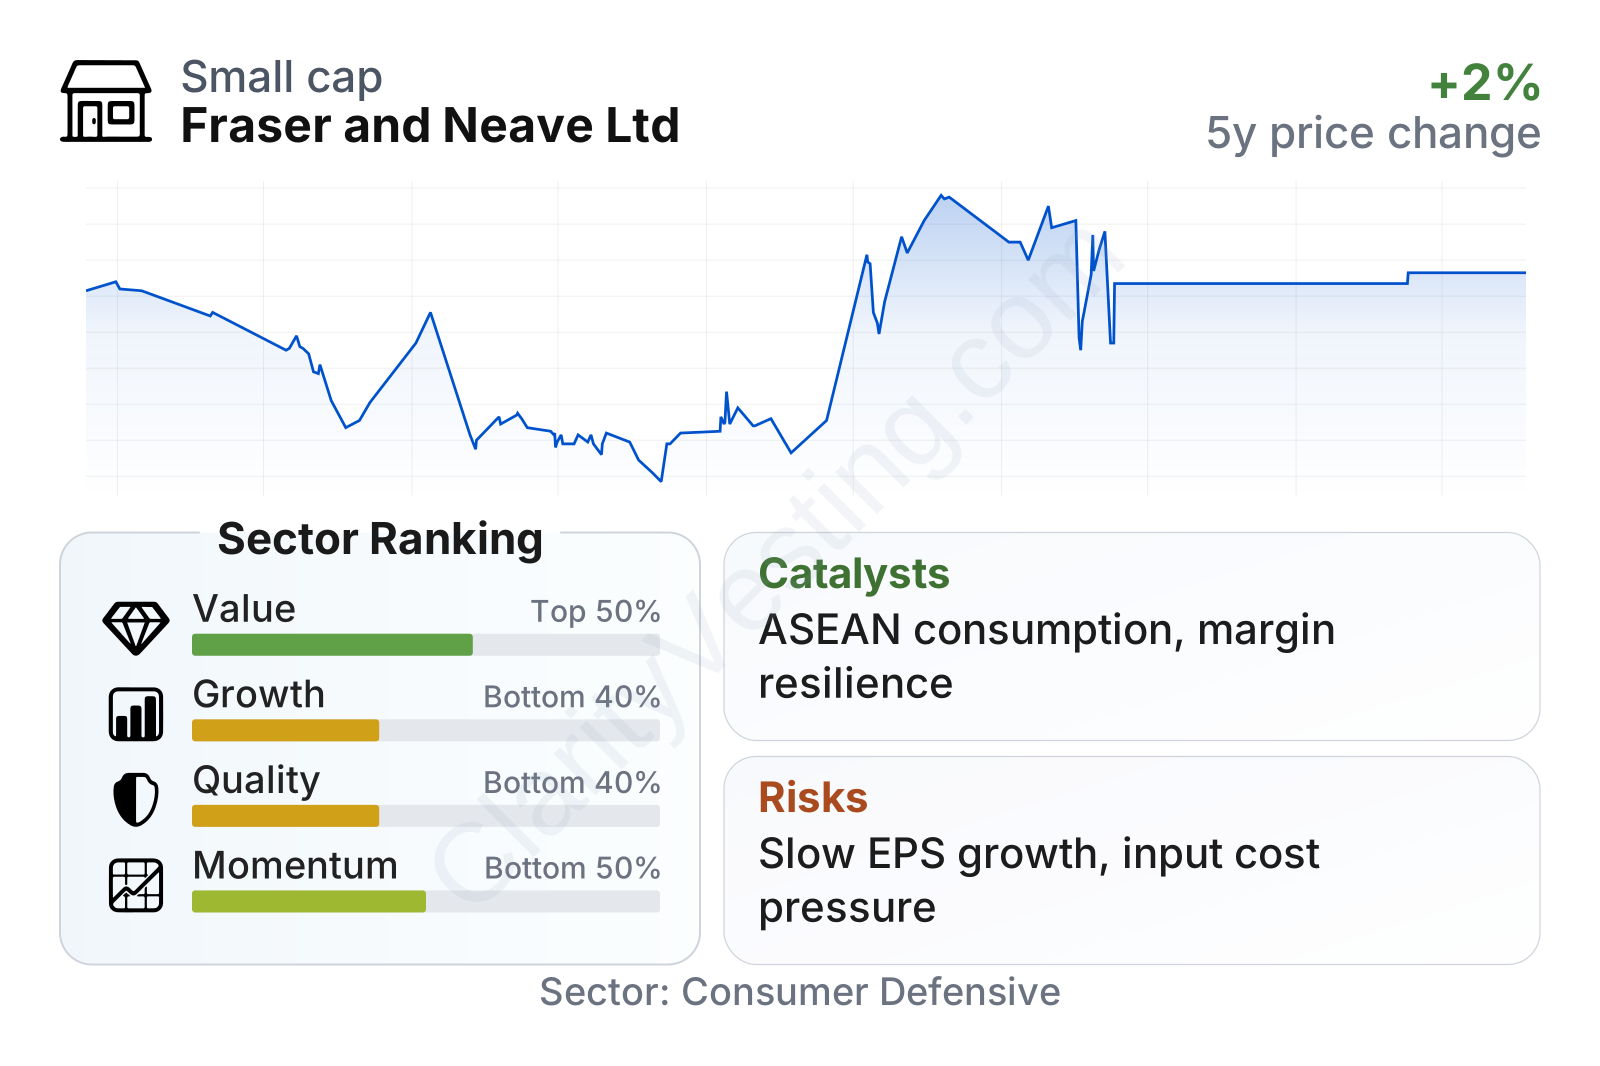
The key metrics point to a mixed profile. Valuation measures look relatively moderate against the sector, especially on earnings and cash flow, while growth and return ratios are weaker than many peers. Profitability at the operating level is better than the sector median, but balance-sheet efficiency and longer-term earnings growth are less impressive. The stock’s volatility is also unusually low, which fits the defensive nature of the business.
The share price has been fairly stable over time, with only modest movement over the last year and stronger gains over three years than the sector median. That pattern suggests the market has treated Fraser and Neave more like a steady consumer name than a fast-growth company.
Growth
Fraser and Neave operates in a sector that generally benefits from long-term population growth, urbanization, and rising household spending in Southeast Asia. Consumer staples are not usually high-growth businesses, but they can expand consistently when they own strong brands, widen distribution, and refresh product offerings. This is especially relevant in categories such as dairy, ready-to-drink beverages, and premium or health-oriented products.
The company’s strategy appears broadly logical for that environment. Its portfolio is concentrated in products that are purchased frequently, and it has established distribution networks in markets where scale and shelf presence matter. This gives it room to grow through product mix, geographic expansion, and selective pricing rather than depending only on major acquisitions.
Recent operating history supports that view to a degree. Revenue has increased over the last several fiscal years, and gross profit has expanded faster than sales. That often points to a healthier mix, firmer pricing, or better manufacturing efficiency. However, recent year-over-year growth has turned negative, so the near-term picture is softer than the multi-year trend.
One notable catalyst is the group’s continued exposure to ASEAN consumption, especially in beverages and dairy, where rising brand penetration can still lift volumes over time. Another is margin resilience: operating margin is above the sector median, which gives the company more flexibility if raw material costs move around. The business also generated strong free cash flow relative to its market value, which can support reinvestment, dividends, or debt management.
Recent company updates and annual reporting have continued to emphasize brand investment, product development, and regional execution rather than a major change in direction. For a company in packaged food and beverages, that kind of consistency can be important because long-term growth often comes from distribution depth and repeat purchases, not from dramatic one-off events.
Risks
This article is for informational purposes only and does not constitute financial advice. Some content is AI-generated. See Disclaimer


