Stock Analysis · Farmers & Merchants Bancorp (FMCB)
Overview
Farmers & Merchants Bancorp is the holding company for Farmers & Merchants Bank of Central California, a long-established community bank serving individuals, families, farms, and local businesses. Its footprint is concentrated in California’s Central Valley and nearby markets, with a business model centered on gathering deposits from local customers and turning those funds into loans and other interest-earning assets.
Like most regional banks, the company makes most of its money from the spread between what it earns on loans and investments and what it pays on deposits and borrowings. Public filings show that revenue is still dominated by interest income, while fee-based activities play a much smaller supporting role.
Main revenue sources can be summarized as follows:
- Net interest income: approximately 85% to 90% of total revenue in recent years. This is the bank’s core engine and includes income from commercial real estate loans, agricultural loans, residential real estate lending, consumer loans, and securities, after funding costs.
- Non-interest income: approximately 10% to 15% of total revenue. This generally includes service charges on deposit accounts, debit card and ATM-related fees, gains or losses on asset sales, and other banking service income.
Within lending, the portfolio has historically been concentrated in real estate-backed and agricultural-related lending, which fits the bank’s Central California franchise. That local specialization matters: it gives the company a clearer niche than a generic small bank, but it also ties performance closely to regional economic conditions, property values, and agricultural activity.
The earnings profile has been fairly resilient. Revenue moved from about $180 million in 2021 to roughly $238 million in 2025, while net income also trended higher over that period. At the same time, funding costs rose sharply as industry-wide interest rates increased, so recent results reflect both the strength of loan yields and the pressure of more expensive deposits.
The business has expanded its revenue base over several years, and profit has remained solid even as interest expense increased materially. That suggests the bank has so far managed the higher-rate environment better than many smaller peers, although the mix between loan yields and deposit costs remains the key moving piece.
Key Figures
| Metric | Value | Sector ⓘ |
|---|---|---|
| Date | Oct 19, 2026 | |
| Context | ||
| Sector | Financial Services | |
| Industry | Banks - Regional | |
| Market Cap ⓘ | $1.00B | |
| Beta ⓘ | 0.16 | |
Value (Cheapness) | ||
| P/E Ratio ⓘ | 10.35 | 12.26 |
| P/B Ratio ⓘ | 1.47 | 1.23 |
| FCF Yield ⓘ | 9.96% | 10.40% |
| Dividend Yield ⓘ | 1.43% | 3.02% |
| EBIT / EV ⓘ | N/A | 8.14% |
| PEG ⓘ | N/A | |
Growth (Business expansion) | ||
| Revenue Growth ⓘ | 6.70% | 9.25% |
| RPS Growth (5Y CAGR) ⓘ | 10.60% | 12.19% |
| EPS Growth (5Y CAGR) ⓘ | 3.68% | -9.36% |
| BVPS Growth (5Y CAGR) ⓘ | 12.06% | 4.99% |
| Margin Growth (5Y Trend) ⓘ | N/A | -3.86% |
| FCF Growth (5Y CAGR) ⓘ | 13.66% | 4.81% |
| DPS Growth (5Y CAGR) ⓘ | 6.72% | 8.79% |
Quality (Business durability) | ||
| ROIC (Latest) ⓘ | N/A | 9.49% |
| ROE (Latest) ⓘ | 14.55% | 13.87% |
| ROA (Latest) ⓘ | 1.68% | 1.54% |
| ROIC (5Y Median) ⓘ | N/A | 7.86% |
| ROE (5Y Median) ⓘ | 15.76% | 12.17% |
| ROA (5Y Median) ⓘ | 1.66% | 1.30% |
| Net Debt / EBIT (Latest) ⓘ | N/A | 0.99 |
| Net Debt / EBIT (5Y Median) ⓘ | N/A | 0.73 |
| Net Debt / EBITDA (Latest) ⓘ | N/A | 0.91 |
| Operating Margin (Latest) ⓘ | N/A | 22.30% |
| Operating Margin (5Y Median) ⓘ | N/A | 24.63% |
| Debt to Equity (Latest) ⓘ | N/A | 58.04% |
| Profit Margin (Latest) ⓘ | 39.77% | 26.57% |
| Free Cash Flow (Latest) ⓘ | $99.56M | |
Momentum (Price trend) | ||
| 3Y Return ⓘ | +63.38% | +88.26% |
| 12M Return (excl. last month) ⓘ | +42.41% | +19.24% |
| 6M Return ⓘ | +21.40% | +4.70% |
| Price vs. 200-Day MA ⓘ | +13.36% | +3.66% |
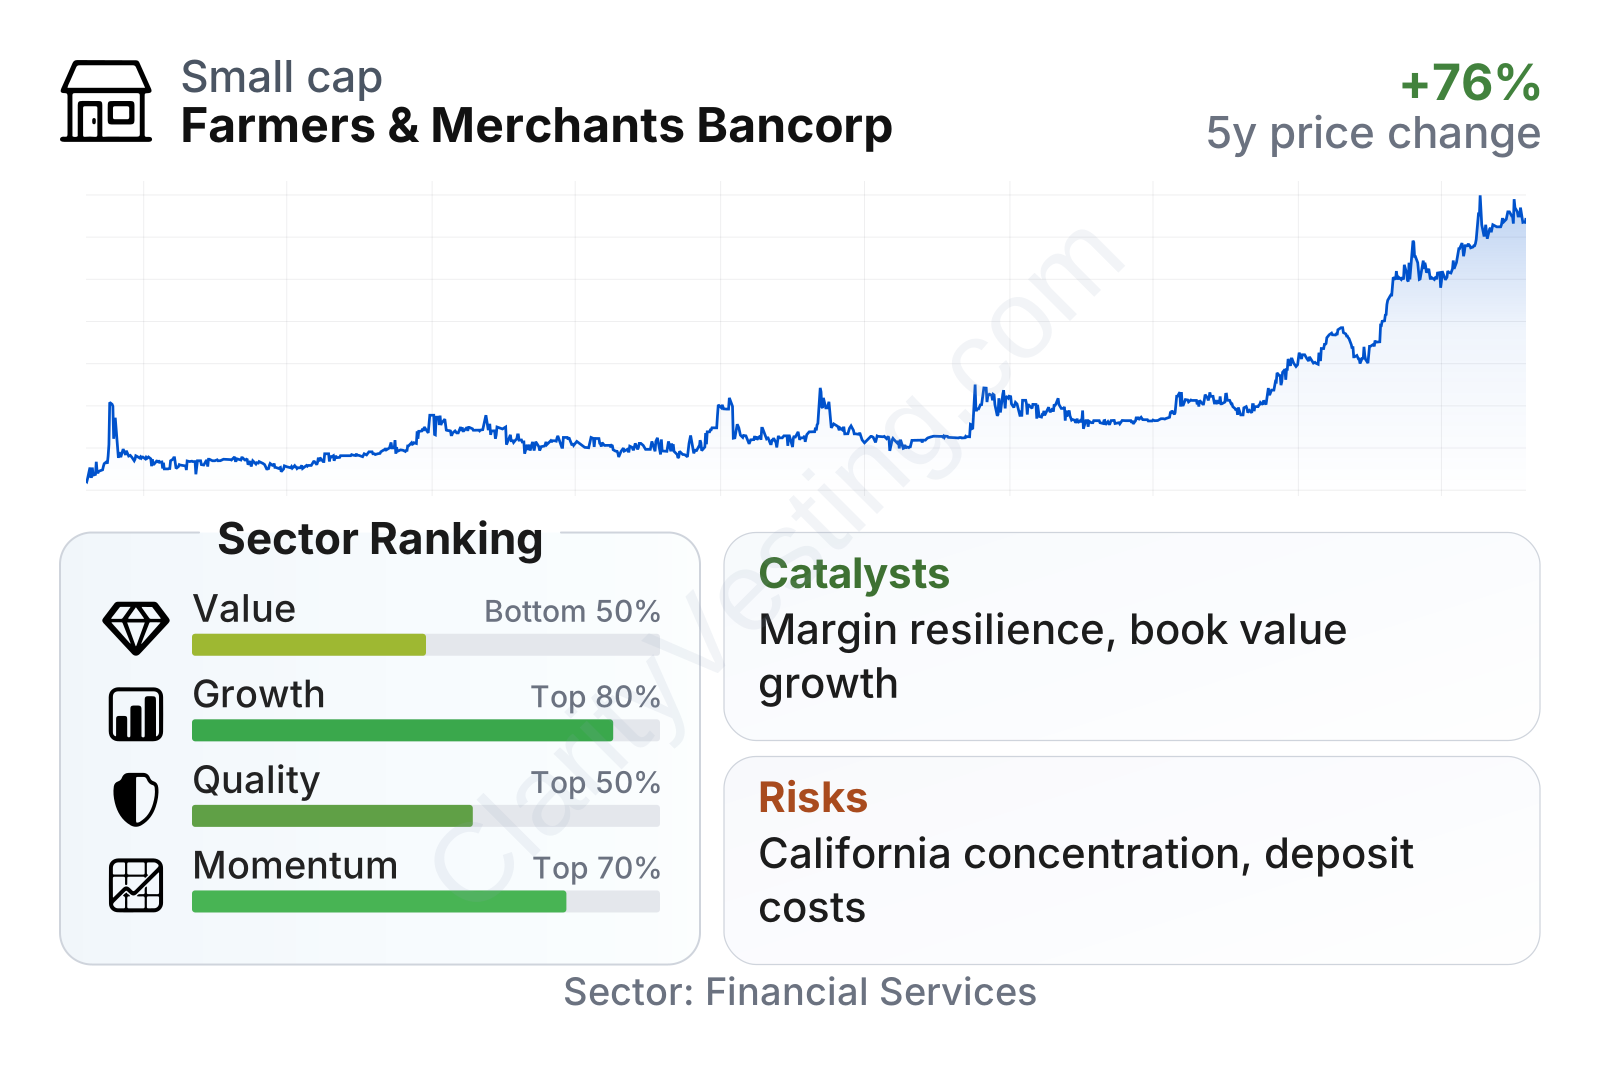
Farmers & Merchants Bancorp is a relatively small publicly traded bank by market value, but its operating profile compares well with many regional-bank peers. Growth and quality metrics are generally above the sector median, especially in book value per share, profit margin, return on equity, and return on assets. Valuation is more mixed: the earnings multiple is below the sector median, while the price-to-book ratio sits somewhat above it, which usually signals that the market is assigning a premium for balance-sheet quality and profitability rather than for rapid expansion. The stock’s low beta also points to unusually muted share-price swings for a bank, even though recent momentum has been strong.
Growth
Regional banking is not a high-growth industry in the same way as software or semiconductors, but it remains an essential sector with steady long-term demand. Local businesses still need credit, households still need mortgages and deposit services, and agricultural regions need lenders that understand seasonal cash flows, land values, and farm economics. In that sense, Farmers & Merchants Bancorp operates in a stable and necessary corner of finance rather than in a fading niche.
The company’s strategy appears coherent for its size. It focuses on relationship banking in a defined geography instead of trying to compete nationwide. That can support durable growth because local market knowledge often helps with underwriting discipline, customer retention, and pricing. For a community bank, protecting credit quality and deposit relationships is often more important than chasing rapid asset growth.
Earnings per share show that profitability has not moved in a straight line. The bank posted very strong results in 2021 and 2022, then earnings dipped in 2023 and 2024 as higher funding costs weighed on the spread business. Even so, the longer-term comparison remains constructive, and the five-year earnings-per-share growth rate is still better than the median regional-bank peer. That pattern is important: it suggests the company has faced the same rate cycle pressure as the industry, but from a position of relative strength.
Book value per share has been a clearer sign of long-term progress. It has increased steadily year after year, with a five-year compound growth rate of about 12%, far above the sector median of about 5%. For banks, book value matters because it reflects the equity base supporting the balance sheet. Consistent growth here usually indicates that earnings are being retained productively and that capital generation has remained healthy.
Another positive feature is operating discipline. While total revenue has risen over time, overhead has stayed comparatively contained, helping support a profit margin of nearly 40%, well above the sector median. That combination of local lending expertise, cost control, and strong capital accumulation is the clearest growth foundation visible today.
As for catalysts, the most important one is margin stability or expansion if deposit costs moderate while loan yields remain favorable. A second catalyst is continued book value growth, which can support the stock over long periods even without dramatic balance-sheet expansion. In a more favorable California credit environment, the bank could also benefit from ongoing demand in commercial real estate, small business lending, and agricultural finance within its core footprint.
Risks
This article is for informational purposes only and does not constitute financial advice. Some content is AI-generated. See Disclaimer


