Stock Analysis · FMC Corporation (FMC)
Overview
FMC Corporation is a crop protection company. It develops, manufactures, and sells agricultural chemicals used by farmers to protect yields from insects, weeds, and plant diseases. Its portfolio includes insecticides, herbicides, fungicides, seed treatment products, and plant health technologies. In simple terms, FMC helps growers reduce crop losses and improve productivity.
The business is heavily centered on crop protection, with revenue coming primarily from products sold to growers and distributors across major agricultural regions. Based on the company’s recent annual reporting structure, revenue is best understood by geography rather than by separate product line percentages.
- Latin America: approximately 33% of revenue. This region includes major crop markets such as Brazil and other South American countries, where demand is linked to soybean, corn, cotton, and sugarcane production.
- North America: approximately 24% of revenue. This mainly covers crop protection sales tied to row crops and specialty agriculture in the United States and Canada.
- Europe, Middle East & Africa: approximately 23% of revenue. This combines a broad range of crop uses across cereals, oilseeds, fruits, and vegetables.
- Asia: approximately 20% of revenue. This includes large and diverse agricultural markets, with demand influenced by rice, cotton, fruits, vegetables, and other intensive crops.
FMC has historically positioned itself as a science-driven agricultural inputs company, with meaningful spending on research and development. That matters because product performance, regulatory approvals, and patent protection can make a major difference in this industry. At the same time, the business is cyclical: sales and profitability can move sharply with farm economics, distributor inventory patterns, weather, and pricing conditions.
Over the last several years, the income profile has changed materially. Revenue peaked above $5.8 billion in 2022, then fell to about $4.5 billion in 2023, $4.2 billion in 2024, and roughly $3.5 billion in 2025. Gross profit also compressed, while operating income turned negative in 2025. Research spending remained substantial even during the downturn, which supports innovation but also limits near-term flexibility when volumes are weak.
The broad financial flow shows a clear deterioration since 2022: lower sales, lower gross profit, and much weaker operating earnings. Research spending has stayed relatively resilient, which supports the long-term product pipeline, but the recent pressure from lower revenue and higher financing costs has heavily weighed on overall results.
Key Figures
| Metric | Value | Sector ⓘ |
|---|---|---|
| Date | Oct 17, 2026 | |
| Context | ||
| Sector | Basic Materials | |
| Industry | Agricultural Inputs | |
| Market Cap ⓘ | $1.29B | |
| Beta ⓘ | 0.46 | |
Value (Cheapness) | ||
| P/E Ratio ⓘ | N/A | 16.90 |
| P/B Ratio ⓘ | 0.63 | 1.65 |
| FCF Yield ⓘ | 12.80% | 5.76% |
| Dividend Yield ⓘ | 9.86% | 2.13% |
| EBIT / EV ⓘ | -12.69% | 6.30% |
| PEG ⓘ | 0.46 | |
Growth (Business expansion) | ||
| Revenue Growth ⓘ | -17.50% | 11.10% |
| RPS Growth (5Y CAGR) ⓘ | -8.24% | 4.49% |
| EPS Growth (5Y CAGR) ⓘ | -77.01% | -13.47% |
| BVPS Growth (5Y CAGR) ⓘ | -9.22% | 5.51% |
| Margin Growth (5Y Trend) ⓘ | -27.76% | -1.54% |
| FCF Growth (5Y CAGR) ⓘ | N/A | 0.37% |
| DPS Growth (5Y CAGR) ⓘ | 5.00% | 6.08% |
Quality (Business durability) | ||
| ROIC (Latest) ⓘ | -7.47% | 9.26% |
| ROA (Latest) ⓘ | -25.99% | 4.91% |
| ROIC (5Y Median) ⓘ | 19.55% | 7.70% |
| ROA (5Y Median) ⓘ | 6.74% | 3.86% |
| Net Debt / EBIT (Latest) ⓘ | N/A | 1.40 |
| Net Debt / EBIT (5Y Median) ⓘ | 3.78 | 1.70 |
| Net Debt / EBITDA (Latest) ⓘ | N/A | 0.95 |
| Net Debt / Assets ⓘ | 41.60% | 13.69% |
| EBITDA / Interest ⓘ | N/A | 12.34 |
| Operating Margin (Latest) ⓘ | -19.69% | 13.20% |
| Operating Margin (5Y Median) ⓘ | 15.35% | 11.80% |
| Debt to Equity (Latest) ⓘ | 261.52% | 40.56% |
| Profit Margin (Latest) ⓘ | -84.83% | 6.43% |
| Free Cash Flow (Latest) ⓘ | $165.40M | |
Momentum (Price trend) | ||
| 3Y Return ⓘ | -85.37% | +68.89% |
| 12M Return (excl. last month) ⓘ | -70.36% | +30.21% |
| 6M Return ⓘ | -52.82% | -4.16% |
| Price vs. 200-Day MA ⓘ | -36.93% | -1.27% |
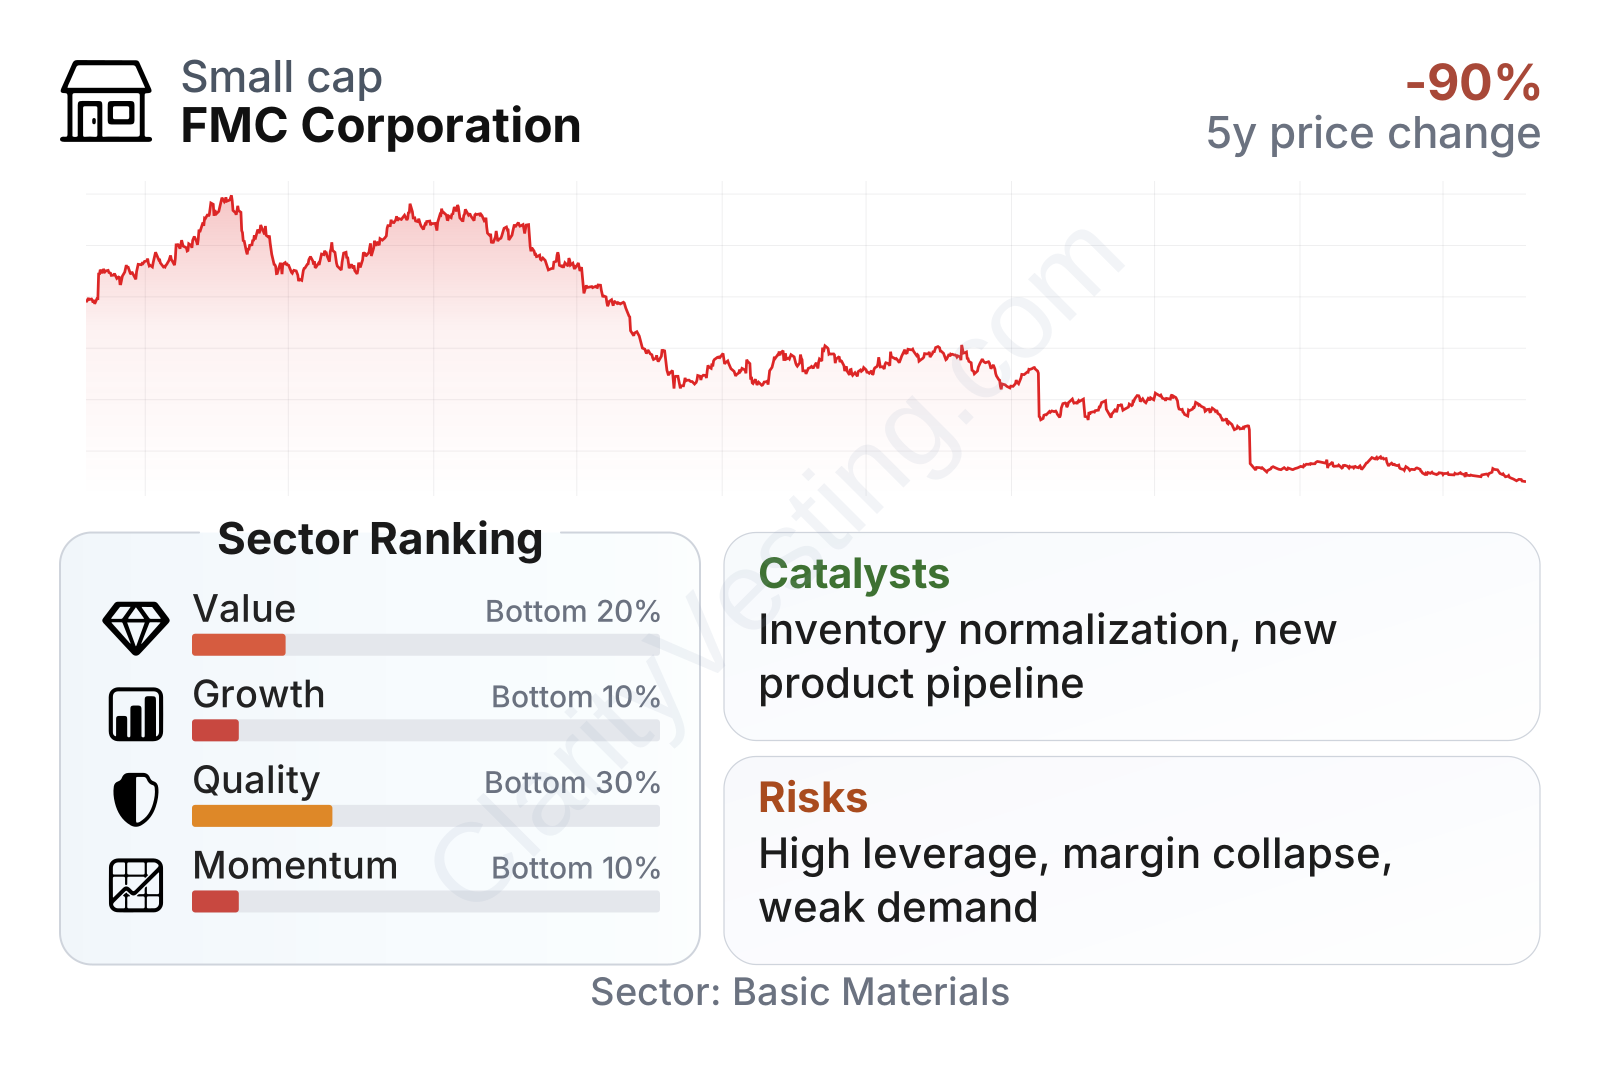
FMC currently screens as very weak on growth, quality, and momentum relative to most companies in its sector, while traditional valuation ratios look optically cheap. That combination usually signals a market that is pricing in serious operating stress rather than simply overlooking the stock. The balance between a high free cash flow yield and deeply negative earnings-based measures shows why headline cheapness needs to be handled carefully here.
Growth
Agricultural inputs is a sector with long-term structural support. The basic drivers are easy to understand: the world needs more efficient food production, growers need to protect yields, and usable farmland does not expand easily. Crop protection remains an essential part of modern agriculture, especially in high-value crops and large-scale row farming. So the sector itself has durable demand foundations, even if annual results can be volatile.
FMC’s strategy also makes sense in principle. The company focuses on proprietary active ingredients, formulation technology, biologicals, and product launches that can expand reach across regions and crops. In this type of business, future growth often depends less on broad economic expansion and more on whether new products gain registrations, whether older products maintain pricing, and whether channel inventories normalize.
The recent growth pattern has been weak. After strong expansion in 2021 and 2022, revenue growth turned sharply negative through much of 2023, briefly stabilized in parts of 2024 and 2025, and then weakened again in 2026. That suggests FMC is still dealing with a difficult operating environment rather than moving through a clean, steady recovery.
Cash generation has also become less dependable. FMC produced positive free cash flow for several periods, but the latest trailing reading moved negative. For a company in the middle of an earnings reset, that is an important signal because it reduces room to absorb downturns, maintain dividends comfortably, and reduce leverage at the same time.
One of the main potential catalysts is a normalization of channel inventories. In crop protection, distributors can sharply reduce orders when they already hold too much product, even if end-farmer demand remains more stable. When those inventories reset, suppliers can see a meaningful rebound in volume. Another possible growth support is FMC’s new product pipeline and biological crop protection efforts, which align with grower demand for productivity and sustainability. If product launches gain traction and pricing stabilizes, operating leverage could improve from depressed levels.
Recent company updates have continued to focus on restructuring actions, portfolio management, cost control, and pipeline execution. Those are sensible steps, but they matter only if they translate into better volumes, margins, and cash generation. For now, the opportunity case depends more on recovery from a trough than on clear evidence of strong underlying expansion.
Risks
This article is for informational purposes only and does not constitute financial advice. Some content is AI-generated. See Disclaimer


