Stock Analysis · Firefly Aerospace Inc (FLY)
Overview
Firefly Aerospace is a space company focused on launch services, spacecraft, and lunar missions. Its core business is helping governments, commercial customers, and research organizations send payloads to orbit or to the Moon. In practical terms, Firefly develops and operates small rockets, builds orbital vehicles and spacecraft platforms, and works on lunar landers through government-backed programs.
The company’s business mix is still evolving, which is common for a relatively young space company. Based on its recent public disclosures and business description, revenue appears to come mainly from launch-related services and space mission contracts, with a meaningful contribution from spacecraft and lunar program work. Exact segment percentages are not consistently broken out in a simple public format, so the most reliable way to think about the business is by activity rather than by formal reporting segment.
Main revenue sources appear to be:
- Launch services — revenue from missions using Firefly’s Alpha rocket and related launch support for government and commercial payloads.
- Spacecraft and orbital services — work tied to space vehicles, mission design, payload integration, and in-space transportation capabilities.
- Lunar and government programs — contracts linked to Moon missions, technology development, and other U.S. government space initiatives, including NASA-related work.
- Engineering and other services — smaller project-based revenue tied to development support, testing, and specialized aerospace work.
Financially, Firefly is still in build-out mode. Revenue has risen sharply over the last few years, but spending has also expanded quickly as the company invests in research, production capacity, and mission execution. That pattern is typical of emerging space firms trying to move from development into repeated commercial operations.
The revenue base has grown quickly, from roughly $55 million in 2023 to about $160 million in 2025, but costs and operating expenses have grown even faster. Research and development remains one of the largest uses of cash, showing that Firefly is still funding future capabilities rather than harvesting mature profits.
Key Figures
| Metric | Value | Sector ⓘ |
|---|---|---|
| Date | Oct 03, 2026 | |
| Context | ||
| Sector | Industrials | |
| Industry | Aerospace & Defense | |
| Market Cap ⓘ | $3.83B | |
| Beta ⓘ | N/A | |
Value (Cheapness) | ||
| P/E Ratio ⓘ | N/A | 22.45 |
| P/B Ratio ⓘ | 3.06 | 1.98 |
| FCF Yield ⓘ | -8.53% | 6.31% |
| Dividend Yield ⓘ | N/A | 1.96% |
| EBIT / EV ⓘ | -12.67% | 4.81% |
| PEG ⓘ | N/A | |
Growth (Business expansion) | ||
| Revenue Growth ⓘ | 656.90% | 9.10% |
| RPS Growth (5Y CAGR) ⓘ | 65.38% | 7.75% |
| EPS Growth (5Y CAGR) ⓘ | N/A | -13.59% |
| BVPS Growth (5Y CAGR) ⓘ | N/A | 6.22% |
| Margin Growth (5Y Trend) ⓘ | N/A | 0.72% |
| FCF Growth (5Y CAGR) ⓘ | N/A | 10.98% |
| DPS Growth (5Y CAGR) ⓘ | N/A | 9.48% |
Quality (Business durability) | ||
| ROIC (Latest) ⓘ | -25.19% | 10.92% |
| ROA (Latest) ⓘ | -25.11% | 5.41% |
| ROIC (5Y Median) ⓘ | N/A | 9.21% |
| ROA (5Y Median) ⓘ | N/A | 4.94% |
| Net Debt / EBIT (Latest) ⓘ | N/A | 2.07 |
| Net Debt / EBIT (5Y Median) ⓘ | N/A | 2.28 |
| Net Debt / EBITDA (Latest) ⓘ | N/A | 1.43 |
| Net Debt / Assets ⓘ | -24.79% | 19.27% |
| EBITDA / Interest ⓘ | N/A | 9.53 |
| Operating Margin (Latest) ⓘ | -136.14% | 10.50% |
| Operating Margin (5Y Median) ⓘ | -238.06% | 10.27% |
| Debt to Equity (Latest) ⓘ | 4.37% | 65.48% |
| Profit Margin (Latest) ⓘ | -129.06% | 6.62% |
| Free Cash Flow (Latest) ⓘ | -$326.49M | |
Momentum (Price trend) | ||
| 3Y Return ⓘ | N/A | +58.56% |
| 12M Return (excl. last month) ⓘ | -53.45% | +15.63% |
| 6M Return ⓘ | -18.69% | +4.19% |
| Price vs. 200-Day MA ⓘ | -16.79% | +0.93% |
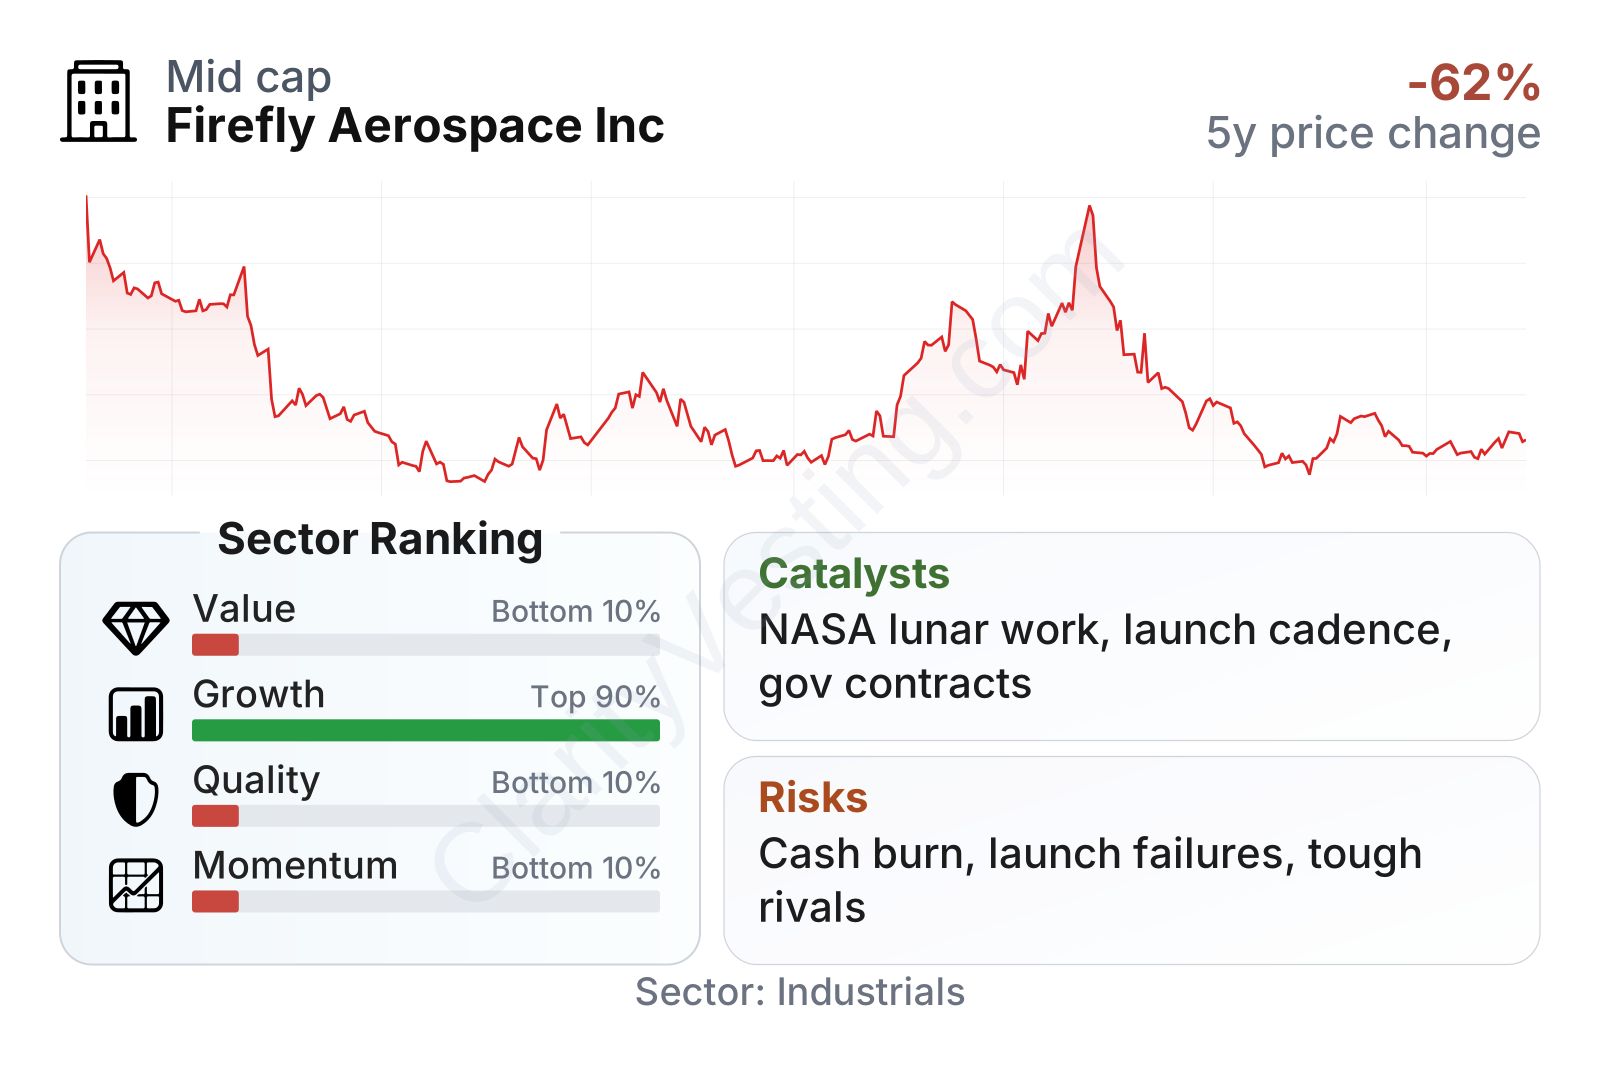
Firefly currently looks like a high-growth but low-profitability company. Its growth profile ranks near the top of the industrial sector, helped by extremely strong year-over-year revenue expansion and a strong multi-year rise in revenue per share. By contrast, value, quality, and momentum metrics rank near the bottom of the sector. In plain language, the business is expanding fast, but it is still generating heavy losses, negative free cash flow, and weak stock performance relative to many industrial peers.
The stock has also been volatile. The share-price history shown above reflects sharp swings within a short period, which often happens with newly public or early-stage aerospace companies where contract wins, launch results, and funding expectations can quickly change sentiment.
Growth
Firefly operates in a sector with strong long-term demand drivers. Space activity is being supported by rising defense spending, continued satellite deployment, interest in responsive launch, and renewed lunar exploration programs. Governments want more launch options, and commercial customers increasingly want specialized mission profiles rather than relying only on the largest launch providers. That creates room for a company like Firefly if it can execute reliably.
Its strategy broadly makes sense for future growth because it is not relying on a single product. Firefly is building a broader platform across small launch, orbital vehicles, and lunar services. That diversification matters. Launch can be unpredictable and low-margin in early years, so adding spacecraft and government mission work can help create a fuller backlog and strengthen customer relationships.
One of the clearest catalysts is the company’s exposure to U.S. government programs, especially NASA and defense-related opportunities. Publicly announced mission awards and lunar development milestones suggest Firefly is participating in areas that could scale if technical execution remains solid. Another important catalyst is cadence: each successful launch or mission can improve credibility, support follow-on awards, and gradually reduce the perception that the company is still experimental.
Recent public updates have also pointed to meaningful operational progress, including continued work on lunar missions and broader national security and civil-space relevance. For a company at this stage, credible execution milestones often matter as much as near-term earnings because they shape future contract opportunities.
Risks
This article is for informational purposes only and does not constitute financial advice. Some content is AI-generated. See Disclaimer


