Stock Analysis · Flowco Holdings Inc (FLOC)
Overview
Flowco Holdings Inc operates in the oilfield equipment and production optimization market. Its business is centered on artificial lift and related production systems used by oil and gas producers to keep wells flowing efficiently. In simple terms, Flowco helps upstream energy companies increase production, improve reliability, and reduce downtime once a well is already drilled and producing.
The company’s activities are tied more to producing wells than to early-stage exploration. That matters because production-support spending can be steadier than drilling activity, although it still depends on oil and gas prices and customer budgets. Flowco has also expanded through acquisitions, which has helped it build a broader product and service offering across equipment, rentals, and aftermarket support.
Based on company filings, annual reports, and investor materials, Flowco’s revenue mix is primarily linked to production equipment sales, rentals, and service-related activity. Public disclosures do not always give a precise split for every line item, but the business can be summarized as follows:
- Production equipment systems and related products — the largest source of revenue. This includes artificial lift equipment and associated hardware used in oil and gas production operations.
- Rental and service activity — a meaningful source of recurring revenue tied to field support, maintenance, installation, and equipment usage in producing wells.
- Aftermarket parts and other support solutions — a smaller but strategically useful stream because it can deepen customer relationships and generate repeat demand over the life of installed equipment.
Financially, the business has scaled quickly over the last several years. Revenue rose from about $149 million in 2022 to roughly $760 million in 2025, while operating income also increased substantially. The overall picture is one of a fast-expanding mid-sized oilfield services company that has become much larger in a short period, although the pace of expansion has also brought changes in costs, leverage, and margins.
The progression over the last four annual periods shows a sharp increase in sales and gross profit, but also a much heavier operating cost structure by 2025. Operating income kept growing, yet net income did not follow at the same pace, which suggests that below-the-line items and a larger expense base have become more important to watch.
Key Figures
| Metric | Value | Sector ⓘ |
|---|---|---|
| Date | Oct 17, 2026 | |
| Context | ||
| Sector | Energy | |
| Industry | Oil & Gas Equipment & Services | |
| Market Cap ⓘ | $2.12B | |
| Beta ⓘ | N/A | |
Value (Cheapness) | ||
| P/E Ratio ⓘ | 15.45 | 15.44 |
| P/B Ratio ⓘ | 2.30 | 1.73 |
| FCF Yield ⓘ | 9.82% | 8.20% |
| Dividend Yield ⓘ | 1.71% | 3.59% |
| EBIT / EV ⓘ | 13.14% | 7.46% |
| PEG ⓘ | N/A | |
Growth (Business expansion) | ||
| Revenue Growth ⓘ | 22.10% | 26.90% |
| RPS Growth (5Y CAGR) ⓘ | -32.73% | 6.90% |
| EPS Growth (5Y CAGR) ⓘ | 66.11% | -15.73% |
| BVPS Growth (5Y CAGR) ⓘ | -52.63% | 6.07% |
| Margin Growth (5Y Trend) ⓘ | -8.75% | 0.58% |
| FCF Growth (5Y CAGR) ⓘ | N/A | 1.86% |
| DPS Growth (5Y CAGR) ⓘ | -61.56% | 16.79% |
Quality (Business durability) | ||
| ROIC (Latest) ⓘ | 26.30% | 11.40% |
| ROA (Latest) ⓘ | 2.75% | 6.06% |
| ROIC (5Y Median) ⓘ | N/A | 10.30% |
| ROA (5Y Median) ⓘ | 8.10% | 5.42% |
| Net Debt / EBIT (Latest) ⓘ | 2.09 | 1.64 |
| Net Debt / EBIT (5Y Median) ⓘ | 4.21 | 1.83 |
| Net Debt / EBITDA (Latest) ⓘ | 0.97 | 1.08 |
| Net Debt / Assets ⓘ | 16.79% | 17.29% |
| EBITDA / Interest ⓘ | 19.55 | 9.64 |
| Operating Margin (Latest) ⓘ | 18.82% | 16.27% |
| Operating Margin (5Y Median) ⓘ | 24.86% | 20.39% |
| Debt to Equity (Latest) ⓘ | 93.70% | 54.76% |
| Profit Margin (Latest) ⓘ | 6.07% | 8.82% |
| Free Cash Flow (Latest) ⓘ | $207.92M | |
Momentum (Price trend) | ||
| 3Y Return ⓘ | N/A | +67.38% |
| 12M Return (excl. last month) ⓘ | +27.21% | +49.19% |
| 6M Return ⓘ | -22.08% | +7.07% |
| Price vs. 200-Day MA ⓘ | -14.61% | +9.56% |
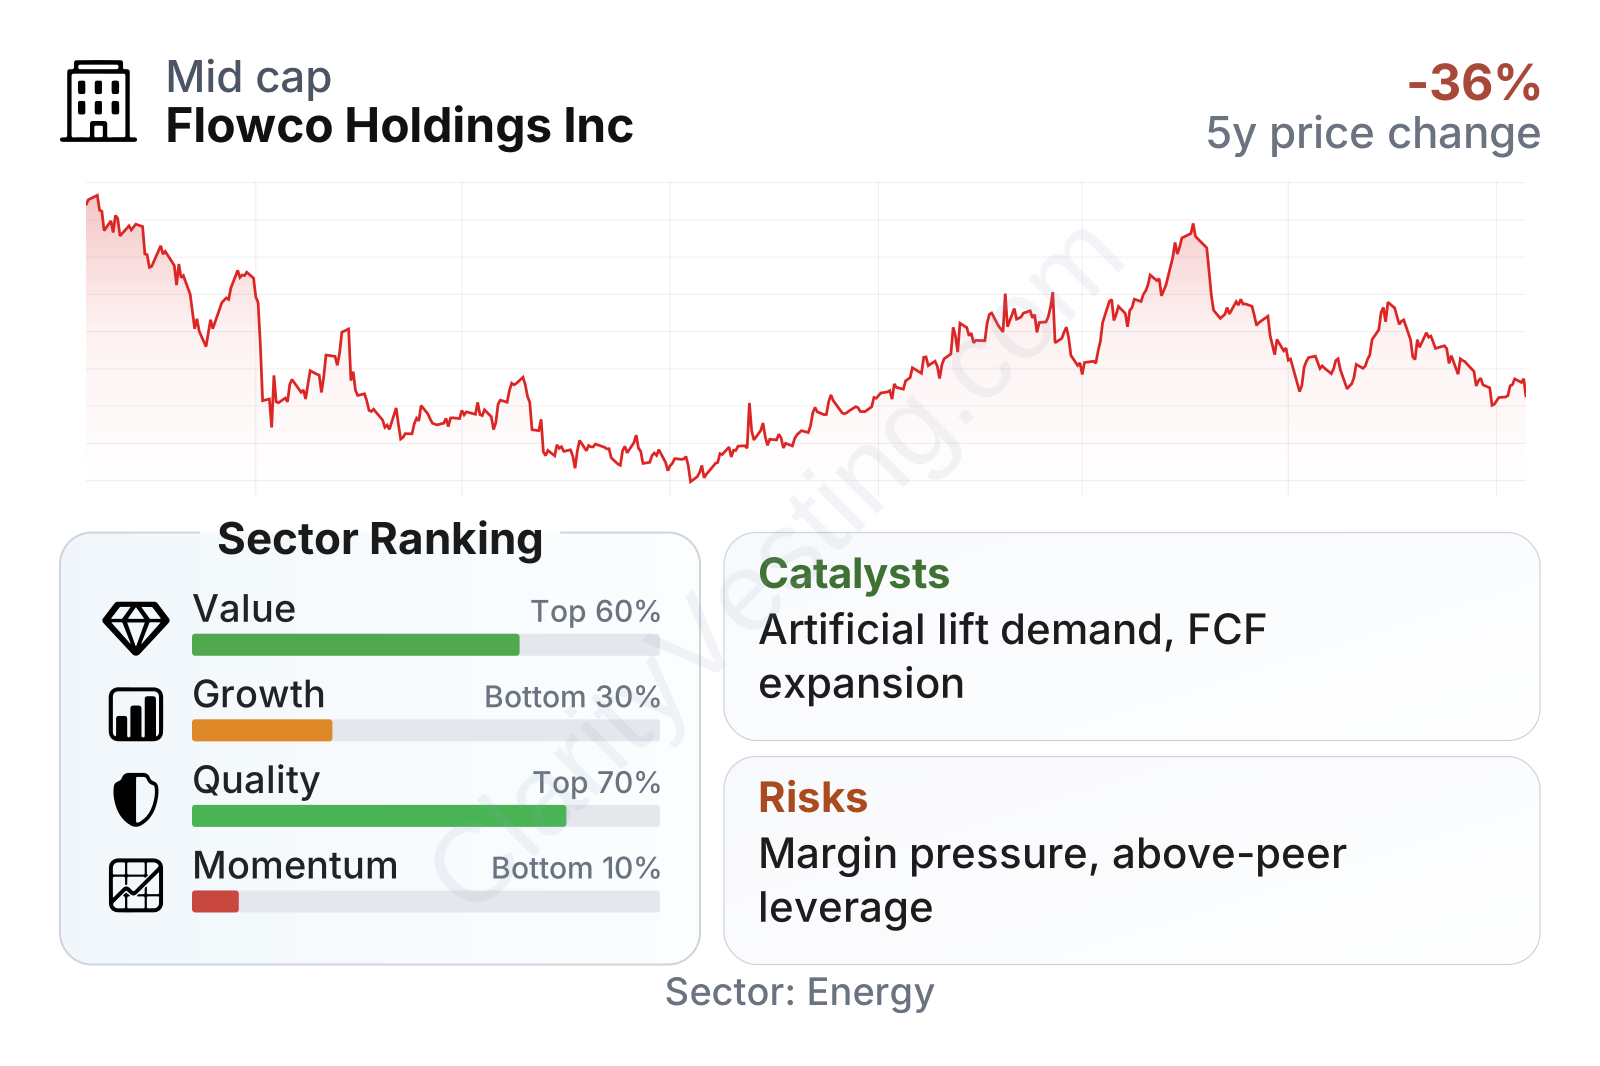
Flowco currently sits in a mixed position. On valuation and business quality, it compares fairly well with much of the energy equipment group: earnings multiple is close to the sector median, free cash flow yield is above median, and return on invested capital stands out positively. The weaker areas are growth consistency and market momentum. Revenue is still growing year over year, but the longer-term per-share growth record is uneven, and the stock’s recent trading trend has lagged much of the sector.
The company is now a mid-cap energy equipment name with a market value around $2 billion. Profitability remains solid at the operating level, free cash flow generation is meaningful, and interest coverage is strong. At the same time, debt relative to equity is higher than the sector median, and net profit margin is below the broader peer group.
Growth
Flowco operates in a sector that should remain relevant as long as oil and gas production stays active, especially in North American shale and other mature producing basins where artificial lift is essential. This is not a high-growth technology market, but it can still offer attractive expansion opportunities because producing wells require ongoing optimization, replacement equipment, maintenance, and efficiency upgrades.
The company’s strategy appears logical for this part of the industry. Rather than depending only on new drilling, it is positioned around the installed base of producing wells. That can support recurring demand through service, rentals, and aftermarket sales. Acquisitions have also played an important role in broadening Flowco’s product offering and customer reach, which has been a major contributor to its rapid increase in scale.
Recent revenue trends show a return to positive year-over-year growth after a volatile period. The latest pace is still healthy in absolute terms, even if it trails the sector median. For a company that has already expanded rapidly, the key question is less about one quarter of growth and more about whether it can convert that larger revenue base into steadier per-share gains over time.
Cash generation is one of the stronger parts of the current profile. Free cash flow has improved materially, reaching a level that gives the company more room to reduce debt, support capital spending, or continue selective expansion. This is especially important in an equipment-and-services business where accounting earnings can move around more than cash flow.
A meaningful catalyst is the continued need for production efficiency in oilfields. Operators increasingly focus on extracting more output from existing wells rather than only chasing volume growth. That trend supports demand for artificial lift systems and field optimization tools. If commodity prices stay supportive and customers keep prioritizing uptime and recovery rates, Flowco’s offering remains well aligned with that spending pattern.
Another possible opportunity comes from integrating past acquisitions more effectively. If management can cross-sell products, improve utilization in rental fleets, and control overhead, the company could turn scale into stronger margins and more durable earnings quality.
Risks
This article is for informational purposes only and does not constitute financial advice. Some content is AI-generated. See Disclaimer


