Stock Analysis · FLEX LNG Ltd (FLNG)
Overview
FLEX LNG Ltd is a shipping company focused on transporting liquefied natural gas, or LNG, by sea. Instead of exploring for gas or producing it, the company sits in the middle of the LNG value chain: it owns and operates specialized carriers that move LNG from exporting countries to import terminals around the world. That makes FLNG closer to a maritime infrastructure business than a traditional oil and gas producer.
The company’s business model is relatively simple. It earns money by chartering out its vessels, mainly under fixed-rate contracts with energy companies, traders, and utilities. These contracts can reduce day-to-day exposure to spot shipping swings, although they do not remove shipping-cycle risk entirely.
Based on company disclosures, revenue is overwhelmingly tied to vessel chartering and related shipping services. The mix is concentrated, which makes the business easy to understand but also dependent on fleet utilization and charter rates.
- Time charter revenues: approximately 95% to 100% — the core business, where customers pay to use LNG carriers for agreed periods at contracted daily rates.
- Voyage and other operating revenues: approximately 0% to 5% — may include spot exposure, positioning voyages, and limited ancillary items depending on contract structure and reporting period.
Operationally, the company runs a modern fleet of LNG carriers, which matters because newer ships are generally more fuel-efficient and more attractive to charterers. In a market where reliability, fuel consumption, and emissions performance affect vessel demand, fleet quality is a meaningful business characteristic.
Over the last several years, revenue has stayed in a fairly tight range, while profitability has remained unusually high for the broader energy sector. At the same time, interest expense has taken a large share of operating earnings, showing how important balance sheet management is for this business.
The visual breakdown highlights a durable feature of FLNG: operating expenses are relatively light compared with revenue, but financing costs absorb a notable portion of the earnings stream. That helps explain why the company can look very profitable at the operating level while still being sensitive to debt costs.
Key Figures
| Metric | Value | Sector ⓘ |
|---|---|---|
| Date | Oct 03, 2026 | |
| Context | ||
| Sector | Energy | |
| Industry | Oil & Gas Midstream | |
| Market Cap ⓘ | $1.67B | |
| Beta ⓘ | 0.16 | |
Value (Cheapness) | ||
| P/E Ratio ⓘ | 16.32 | 14.47 |
| P/B Ratio ⓘ | 2.37 | 1.70 |
| FCF Yield ⓘ | 9.14% | 8.66% |
| Dividend Yield ⓘ | 9.74% | 3.77% |
| EBIT / EV ⓘ | 5.98% | 7.46% |
| PEG ⓘ | N/A | |
Growth (Business expansion) | ||
| Revenue Growth ⓘ | 24.20% | 27.35% |
| RPS Growth (5Y CAGR) ⓘ | -0.05% | 6.75% |
| EPS Growth (5Y CAGR) ⓘ | -22.58% | -15.45% |
| BVPS Growth (5Y CAGR) ⓘ | -5.50% | 5.85% |
| Margin Growth (5Y Trend) ⓘ | -15.44% | 0.75% |
| FCF Growth (5Y CAGR) ⓘ | N/A | 3.62% |
| DPS Growth (5Y CAGR) ⓘ | 12.77% | 16.85% |
Quality (Business durability) | ||
| ROIC (Latest) ⓘ | 9.19% | 11.33% |
| ROA (Latest) ⓘ | 3.92% | 6.03% |
| ROIC (5Y Median) ⓘ | 8.66% | 10.16% |
| ROA (5Y Median) ⓘ | 4.46% | 5.34% |
| Net Debt / EBIT (Latest) ⓘ | 7.60 | 1.62 |
| Net Debt / EBIT (5Y Median) ⓘ | 6.15 | 1.91 |
| Net Debt / EBITDA (Latest) ⓘ | 5.33 | 1.06 |
| Net Debt / Assets ⓘ | 54.49% | 17.29% |
| EBITDA / Interest ⓘ | 3.05 | 9.64 |
| Operating Margin (Latest) ⓘ | 50.96% | 16.32% |
| Operating Margin (5Y Median) ⓘ | 62.69% | 19.53% |
| Debt to Equity (Latest) ⓘ | 255.33% | 54.41% |
| Profit Margin (Latest) ⓘ | 28.50% | 8.79% |
| Free Cash Flow (Latest) ⓘ | $152.56M | |
Momentum (Price trend) | ||
| 3Y Return ⓘ | +42.79% | +62.93% |
| 12M Return (excl. last month) ⓘ | +29.62% | +44.83% |
| 6M Return ⓘ | +8.69% | -1.62% |
| Price vs. 200-Day MA ⓘ | +8.41% | +5.18% |
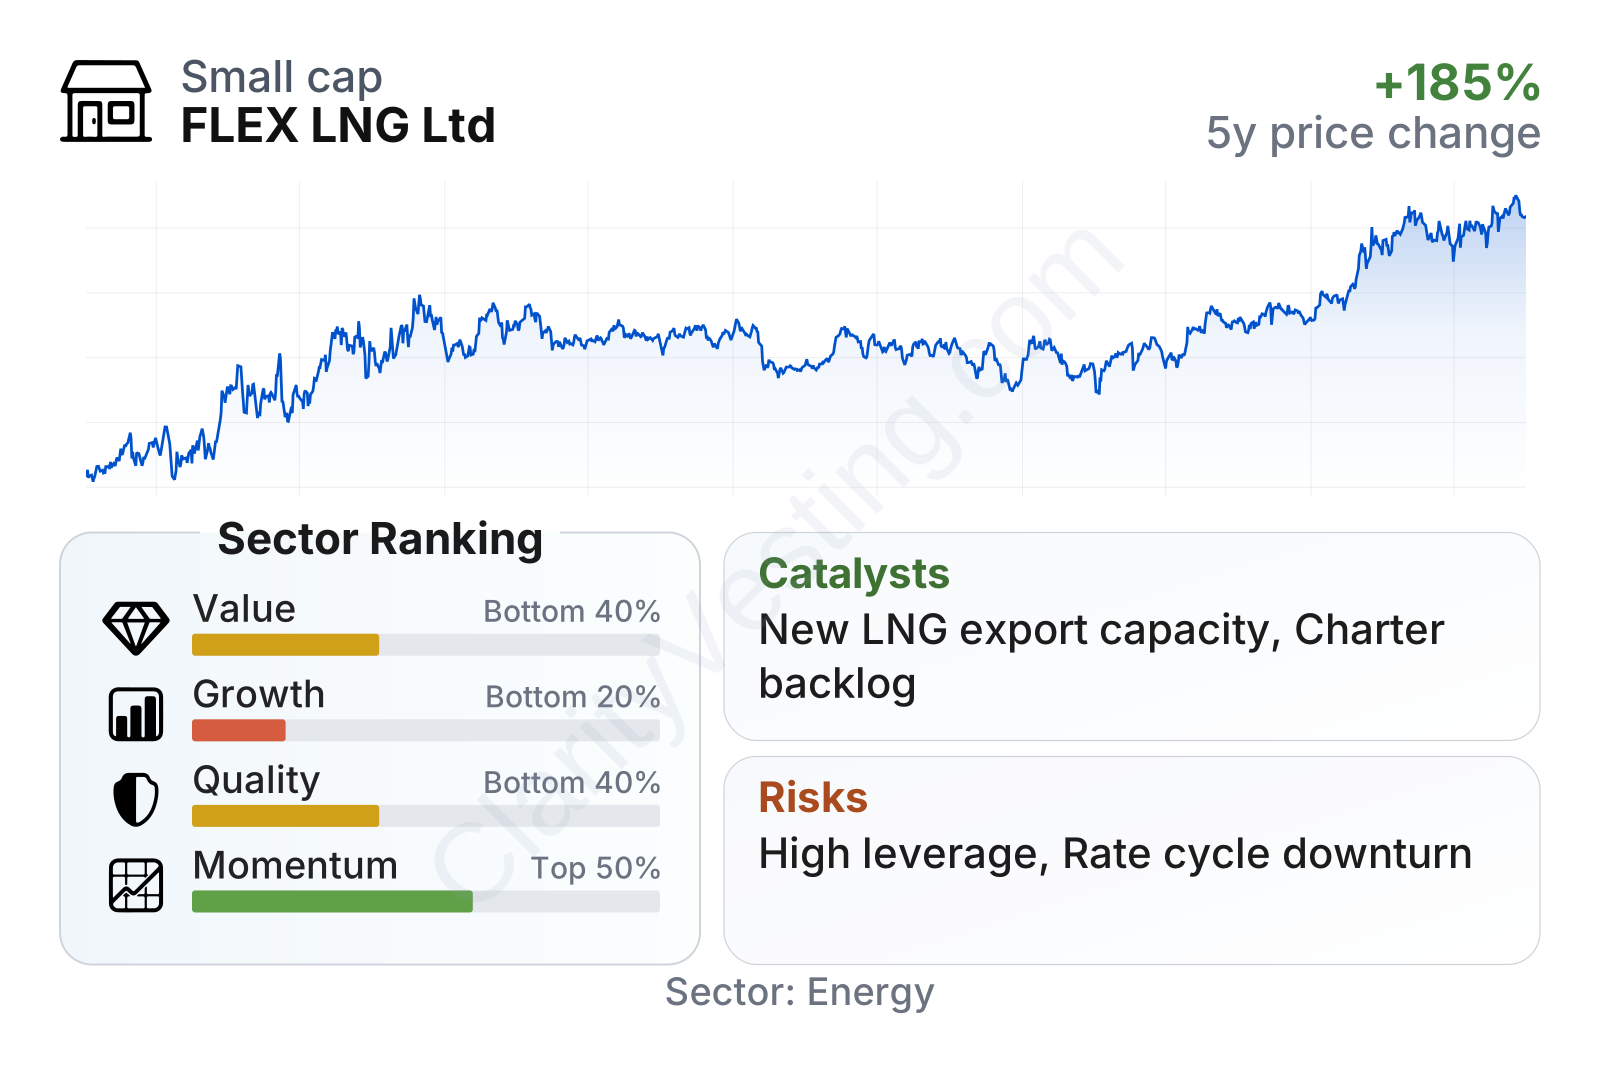
FLNG is a mid-sized company in the energy universe, with a stock that has shown relatively low volatility compared with many energy names. The latest factor snapshot points to a mixed profile: income generation stands out, margins remain strong, and recent share-price momentum has been decent, but growth and balance sheet strength are weaker areas. Valuation is not stretched on earnings alone, yet it is also not obviously cheap once debt and slower long-term growth are taken into account.
Growth
The LNG shipping market benefits from a long-term structural trend: global gas trade continues to rely on seaborne transportation, especially as Europe replaces pipeline supply with imported LNG and Asian demand remains important. New export capacity coming from the United States and Qatar can support vessel demand over time because more cargoes generally need more shipping capacity.
For FLNG, the growth case is less about building a huge new business line and more about keeping a high-quality fleet employed at attractive rates, extending charter visibility, and converting contracted revenue into cash. That strategy makes sense in a capital-intensive shipping segment where stable utilization can be as important as headline expansion.
Revenue growth has been uneven rather than consistently upward. There were periods of contraction through 2024 and 2025, followed by a much stronger rebound in the most recent year-over-year reading. That pattern suggests FLNG is still exposed to contract timing and shipping-market conditions, even though its charter model smooths results more than pure spot exposure would.
Cash generation has remained positive, but the trend has softened from earlier highs. Free cash flow is still meaningful for a company of this size, which supports dividends and debt service, yet the direction matters: a lower cash cushion gives management less flexibility if charter conditions weaken or refinancing becomes more expensive.
A practical catalyst for the company is continued tightness in modern LNG carrier availability, especially if new LNG export projects ramp faster than vessel supply. Another support is FLNG’s commercial focus on securing charters with established counterparties, which can preserve earnings visibility. Recent company communications have also emphasized contract backlog and fleet employment, both of which are important indicators for near- to medium-term revenue stability.
Risks
This article is for informational purposes only and does not constitute financial advice. Some content is AI-generated. See Disclaimer


