Stock Analysis · Flagstar Financial Inc (FLG)
Overview
Flagstar Financial is a regional banking company in the United States. The group operates a large deposit-gathering bank, makes commercial and consumer loans, services mortgages, and offers fee-based banking activities such as payments, wealth-related services, and loan servicing. After the rebranding from New York Community Bancorp to Flagstar Financial, the company’s identity is built around combining traditional banking with a meaningful mortgage platform and a national deposit franchise.
Like most banks, Flagstar does not earn revenue in the same way as an industrial or software company. Its largest source is typically net interest income, which is the spread between what it earns on loans and securities and what it pays on deposits and other funding. The rest comes from noninterest income such as mortgage banking, servicing, deposit-related fees, and other banking services. Based on the company’s recent business mix and public filings, the revenue base can be summarized approximately as follows:
- Net interest income: about 65% to 75% of total revenue in a normal quarter. This includes income from commercial real estate loans, multifamily lending, residential mortgages, warehouse lending, securities, and other interest-earning assets, minus deposit and borrowing costs.
- Mortgage-related income and servicing: about 10% to 20%. This includes mortgage originations, gain-on-sale activity, and servicing income tied to home loans the company manages on behalf of investors.
- Deposit, payments, and other banking fees: about 5% to 10%. This covers account-related fees, treasury management, card and payment activity, and selected commercial banking services.
- Other noninterest income: about 5% to 10%. This can include wealth, capital markets-related items, servicing adjustments, and miscellaneous banking income.
What stands out is that Flagstar is not a niche lender with only one engine. It has a broad balance sheet and several business lines, but the core economics still depend heavily on funding costs, credit performance, and the ability to stabilize earnings after a difficult period for regional banks.
The business flow over the last several years shows that revenue expanded sharply during the integration period, but profitability weakened as interest expense and operating costs surged. In 2025, expenses and funding pressure improved versus 2024, yet earnings were still close to break-even, which helps explain why the market continues to value the company cautiously.
Key Figures
| Metric | Value | Sector ⓘ |
|---|---|---|
| Date | Oct 03, 2026 | |
| Context | ||
| Sector | Financial Services | |
| Industry | Banks - Regional | |
| Market Cap ⓘ | $4.84B | |
| Beta ⓘ | 0.99 | |
Value (Cheapness) | ||
| P/E Ratio ⓘ | 389.00 | 12.60 |
| P/B Ratio ⓘ | 0.68 | 1.23 |
| FCF Yield ⓘ | 1.63% | 10.16% |
| Dividend Yield ⓘ | 0.34% | 2.96% |
| EBIT / EV ⓘ | 0.72% | 7.77% |
| PEG ⓘ | 0.47 | |
Growth (Business expansion) | ||
| Revenue Growth ⓘ | 15.30% | 9.50% |
| RPS Growth (5Y CAGR) ⓘ | -0.02% | 12.10% |
| EPS Growth (5Y CAGR) ⓘ | -62.87% | -9.45% |
| BVPS Growth (5Y CAGR) ⓘ | -18.99% | 5.01% |
| Margin Growth (5Y Trend) ⓘ | N/A | -4.07% |
| FCF Growth (5Y CAGR) ⓘ | N/A | 4.96% |
| DPS Growth (5Y CAGR) ⓘ | -52.43% | 8.79% |
Quality (Business durability) | ||
| ROIC (Latest) ⓘ | 0.27% | 9.60% |
| ROE (Latest) ⓘ | 0.38% | 13.84% |
| ROA (Latest) ⓘ | 0.05% | 1.53% |
| ROIC (5Y Median) ⓘ | N/A | 7.86% |
| ROE (5Y Median) ⓘ | -1.36% | 12.20% |
| ROA (5Y Median) ⓘ | -0.08% | 1.29% |
| Net Debt / EBIT (Latest) ⓘ | 125.25 | 0.91 |
| Net Debt / EBIT (5Y Median) ⓘ | N/A | 0.74 |
| Net Debt / EBITDA (Latest) ⓘ | 49.16 | 0.97 |
| Operating Margin (Latest) ⓘ | 1.92% | 22.12% |
| Operating Margin (5Y Median) ⓘ | -0.83% | 24.39% |
| Debt to Equity (Latest) ⓘ | 134.34% | 60.37% |
| Profit Margin (Latest) ⓘ | 2.36% | 26.62% |
| Free Cash Flow (Latest) ⓘ | $79.00M | |
Momentum (Price trend) | ||
| 3Y Return ⓘ | -63.30% | +89.23% |
| 12M Return (excl. last month) ⓘ | +2.18% | +17.35% |
| 6M Return ⓘ | -12.44% | +10.00% |
| Price vs. 200-Day MA ⓘ | -14.15% | +3.73% |
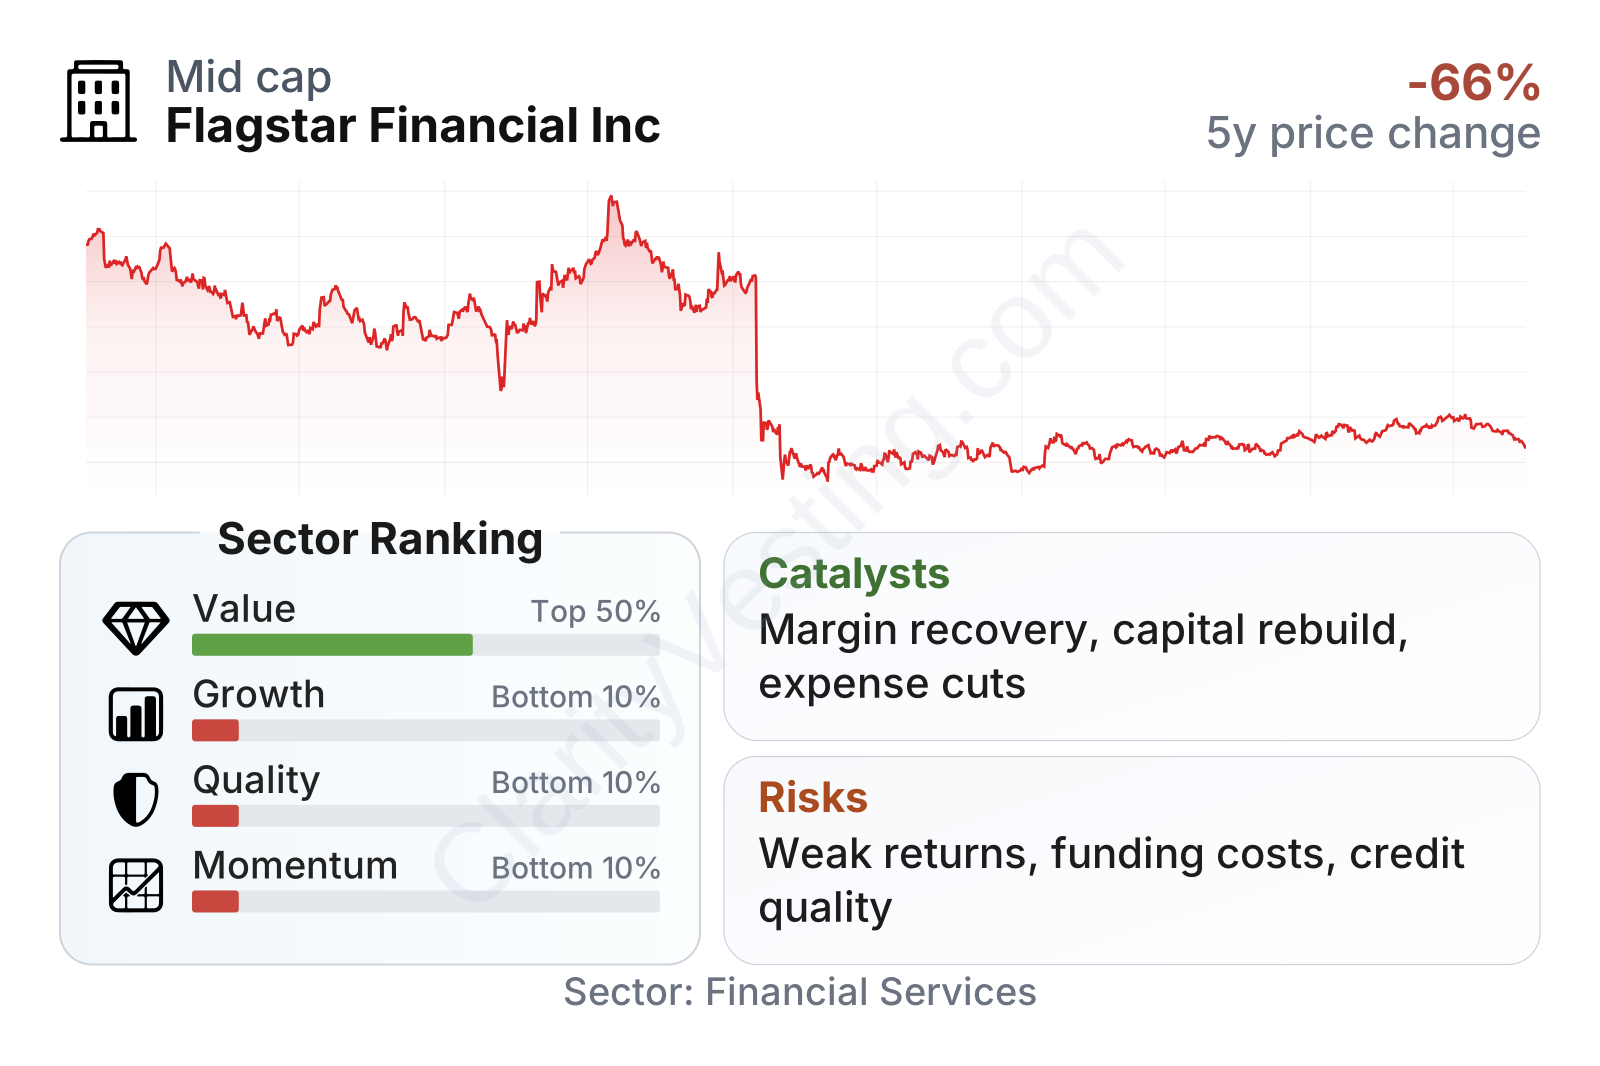
Flagstar is a mid-sized regional bank with a market value around $5 billion and share-price volatility close to the broader market. The overall picture in the latest metrics is mixed but leans weak: valuation looks inexpensive on book value, yet most quality, growth, and momentum indicators sit in the lower end of the regional-bank peer group. The extremely high earnings multiple is not a sign of market optimism; it mainly reflects very low current earnings. At the same time, the price-to-book ratio remains below the sector median, showing that the market still discounts the company’s asset base and recovery prospects.
The share-price history also shows how confidence changed over time. After trading near the low $30s in 2021 and 2023, the stock fell sharply in 2024 during the company’s stress period, then recovered into 2025 and 2026. That rebound suggests stabilization, but not a full restoration of market trust.
Growth
Flagstar operates in a sector that is mature rather than structurally high-growth, but that does not mean growth is impossible. Regional banks can still expand through deposit gathering, loan growth in targeted categories, mortgage servicing, and efficiency improvements after acquisitions or restructurings. For Flagstar, the most important growth question is not whether banking demand exists, but whether the company can convert its larger platform into stable and repeatable profitability.
The strategy has a rational logic. The company has scale in regional banking, a recognizable mortgage platform, and a broad deposit network. If management can keep deposit costs under control, improve operating efficiency, and return problem assets to a more normal level, earnings could improve faster than revenue. That matters because recent year-over-year revenue growth has been better than the sector median, yet long-term per-share growth has remained weak. In simple terms, the bank became larger, but not yet consistently better on a per-share basis.
The earnings trend illustrates the challenge clearly. Earnings per share moved from solid profitability in 2021 and 2022 to losses in 2024, followed by partial repair in 2025 and only a small positive level more recently. For long-term analysis, this is less about one quarter and more about whether the bank can sustain a return to normal earnings power over several years.
Book value per share is another important signal for banks, because it reflects the value of equity supporting the balance sheet. Flagstar’s book value per share has fallen materially since its earlier peak, which means the company has had to absorb significant pressure through losses, capital actions, or balance-sheet changes. A durable recovery would look stronger if book value stabilizes and eventually resumes growing.
Recent company updates have centered on strengthening capital, simplifying the balance sheet, and improving the funding profile. Those are not flashy catalysts, but they are the right ones for a bank in repair mode. If interest rates remain supportive for deposit margins and management continues reducing expensive funding and noncore exposures, the opportunity is a gradual rebuild in profitability rather than a sudden growth surge.
Risks
This article is for informational purposes only and does not constitute financial advice. Some content is AI-generated. See Disclaimer


