Stock Analysis · Figma Inc (FIG)
Overview
Figma is a cloud-based software company focused on digital design and product development. Its tools help teams design apps, websites, interfaces, and brand assets, then share that work in real time with colleagues, developers, and clients. The core appeal is collaboration: instead of passing files back and forth, multiple people can work in the same project through a browser-based platform.
The company has expanded beyond interface design into a broader product suite. Alongside its original design product, Figma now offers tools for whiteboarding, presentation creation, developer handoff, and content support. That wider platform matters because it gives Figma more ways to increase spending from the same customer and makes the product more embedded in day-to-day workflows.
Figma’s revenue is primarily subscription-based. Public company materials indicate that the business is overwhelmingly driven by software subscriptions, while other revenue sources are much smaller. A simple way to think about the mix is:
- Subscription revenue: about 95% to 99% — recurring fees from paid seats and enterprise contracts across products such as Figma Design, FigJam, Dev Mode, Slides, and related collaboration tools.
- Professional services and other revenue: about 1% to 5% — onboarding, support, and limited service-related activity tied to enterprise adoption.
This is generally an attractive model because recurring software revenue tends to be more predictable than one-time sales. The business also appears to convert a high share of revenue into gross profit, showing that delivering the software itself is relatively inexpensive compared with the value customers receive. At the same time, recent losses have been driven much more by operating expenses than by weak underlying gross economics.
The operating picture shows a business with strong gross profit generation but sharply higher spending on research, development, and go-to-market efforts over the last two years. That combination suggests management is still prioritizing expansion and platform breadth over near-term accounting profitability.
Key Figures
| Metric | Value | Sector ⓘ |
|---|---|---|
| Date | Oct 24, 2026 | |
| Context | ||
| Sector | Technology | |
| Industry | Software - Application | |
| Market Cap ⓘ | $11.48B | |
| Beta ⓘ | N/A | |
Value (Cheapness) | ||
| P/E Ratio ⓘ | N/A | 29.68 |
| FCF Yield ⓘ | 2.01% | 4.28% |
| Dividend Yield ⓘ | N/A | 1.30% |
| EBIT / EV ⓘ | -15.63% | 2.70% |
| PEG ⓘ | 7.95 | |
Growth (Business expansion) | ||
| Revenue Growth ⓘ | 48.20% | 15.80% |
| RPS Growth (5Y CAGR) ⓘ | 41.20% | 8.56% |
| EPS Growth (5Y CAGR) ⓘ | N/A | -11.54% |
| Margin Growth (5Y Trend) ⓘ | N/A | 0.46% |
| FCF Growth (5Y CAGR) ⓘ | -51.34% | 9.76% |
| DPS Growth (5Y CAGR) ⓘ | N/A | 7.79% |
Quality (Business durability) | ||
| ROIC (Latest) ⓘ | -83.59% | 9.38% |
| ROIC (5Y Median) ⓘ | N/A | 8.32% |
| Net Debt / EBIT (Latest) ⓘ | N/A | 0.52 |
| Net Debt / EBIT (5Y Median) ⓘ | N/A | 0.46 |
| Net Debt / EBITDA (Latest) ⓘ | N/A | 0.28 |
| Net Debt / Assets ⓘ | -16.08% | 3.44% |
| EBITDA / Interest ⓘ | N/A | 13.20 |
| Operating Margin (Latest) ⓘ | -121.98% | 9.70% |
| Operating Margin (5Y Median) ⓘ | -105.88% | 8.51% |
| Debt to Equity (Latest) ⓘ | 4.58% | 33.40% |
| Profit Margin (Latest) ⓘ | -123.15% | 7.14% |
| Free Cash Flow (Latest) ⓘ | $231.01M | |
Momentum (Price trend) | ||
| 3Y Return ⓘ | N/A | +55.43% |
| 12M Return (excl. last month) ⓘ | -60.06% | +10.33% |
| 6M Return ⓘ | +19.46% | +7.97% |
| Price vs. 200-Day MA ⓘ | -3.79% | +5.41% |
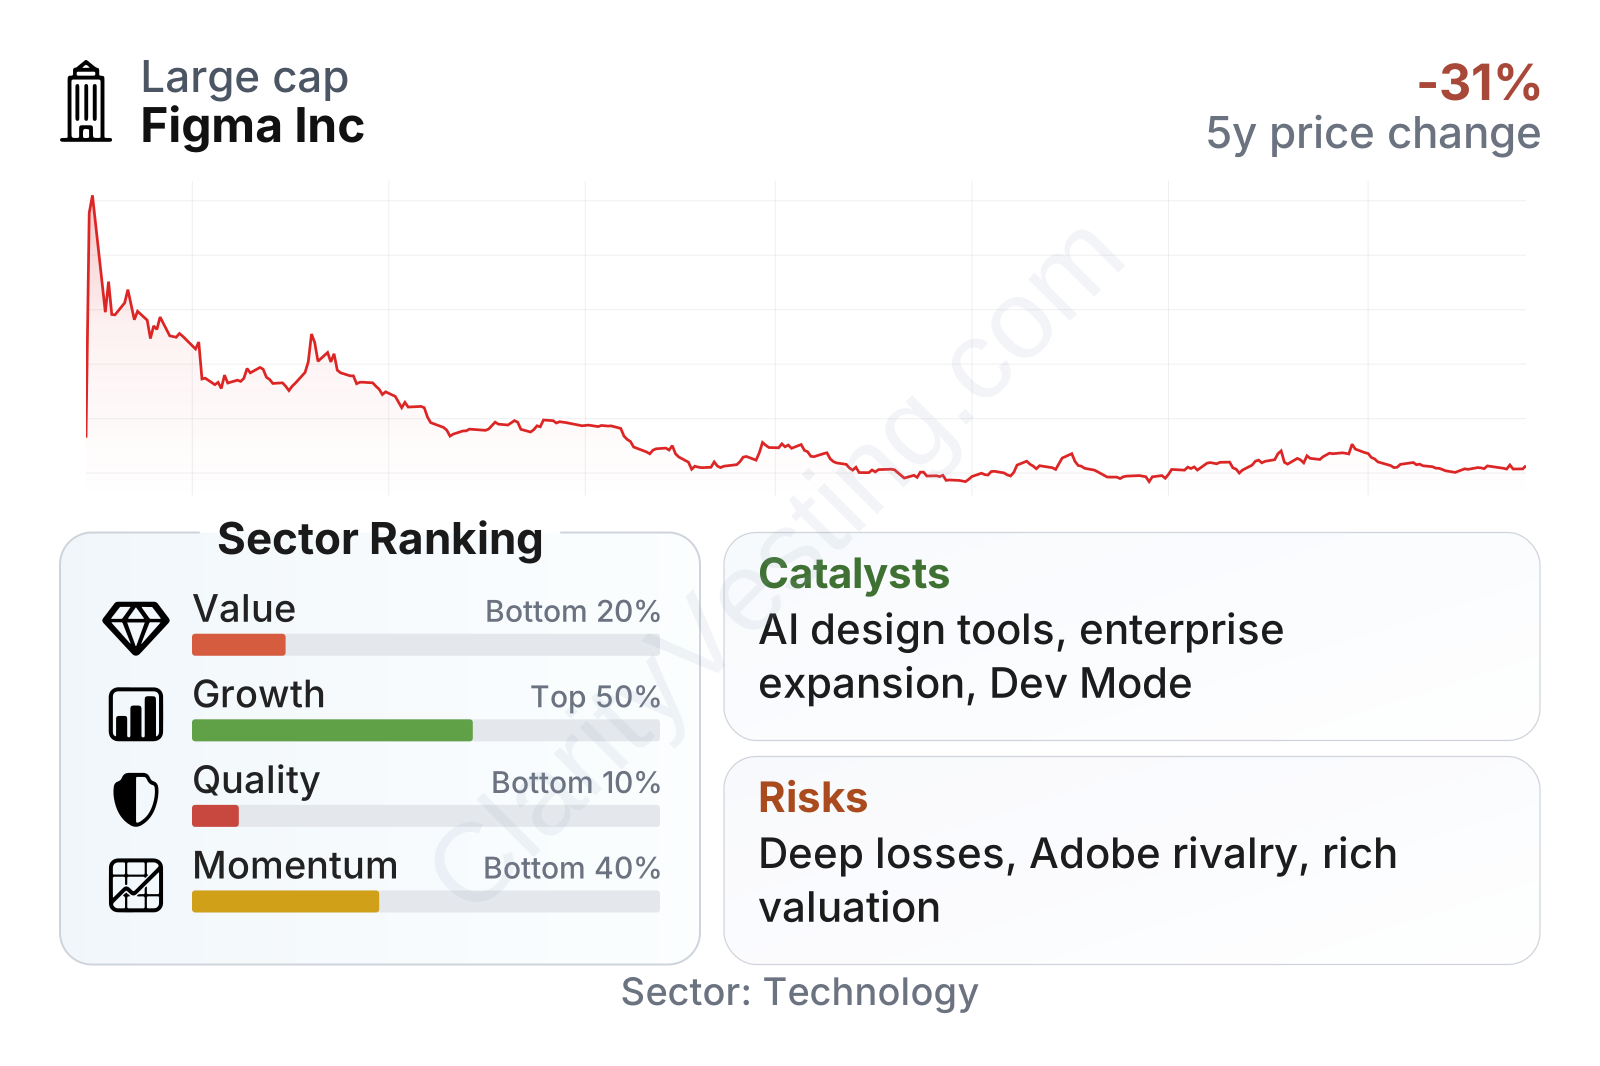
Figma combines strong top-line expansion with unusually weak current profitability metrics. Revenue growth is running well above the software sector median, and its multi-year revenue-per-share growth also stands out positively. On the other hand, value measures look expensive relative to peers, quality metrics are depressed by large operating losses, and recent share-price momentum has been weak. In short, the numbers point to a company still being valued mainly on future potential rather than current earnings power.
Growth
Figma operates in a part of software that still has room to grow: collaborative design, digital product creation, and workflow tools for teams building software and online experiences. Those markets benefit from several durable trends, including ongoing digitization of business processes, the spread of product-led development, remote and distributed work, and the need for faster coordination between designers, developers, and non-technical teams.
Its strategy for future growth is coherent. Figma started with design, but it is steadily building a broader workspace around the full product-development process. That matters because a company that first enters through designers can later expand into product managers, developers, marketers, and executives. Newer products such as FigJam, Dev Mode, and Slides are important because they increase the number of use cases per customer and reduce the risk of being seen as just a single-purpose design app.
Another favorable point is customer behavior in software collaboration tools: once teams standardize on a shared platform, switching can become inconvenient. Files, workflows, internal training, and cross-team habits create friction against moving away. That does not make Figma untouchable, but it does support the possibility of durable retention and expansion if the platform continues to improve.
A major catalyst is the growing role of AI in design and software creation. If AI makes it easier to generate layouts, prototypes, code-ready assets, and content variations, Figma is in a position to capture that activity inside its existing workflow rather than outside it. The company has also continued to launch products and features that widen its addressable market, which could help growth remain strong even if the core design category matures over time.
Recent company updates have also kept attention on enterprise adoption and product expansion. The most important opportunity is not just adding new customers, but increasing usage across larger organizations by becoming a central collaboration layer between design and engineering. If that happens, Figma’s revenue base can scale materially without relying only on basic seat growth.
Risks
This article is for informational purposes only and does not constitute financial advice. Some content is AI-generated. See Disclaimer


