Stock Analysis · First Hawaiian Inc (FHB)
Overview
First Hawaiian Inc. is a regional bank centered on Hawaii, with additional operations in Guam and Saipan. Through its main banking subsidiary, First Hawaiian Bank, it provides everyday banking services for consumers, small businesses, and commercial clients. That includes checking and savings accounts, residential mortgages, commercial real estate lending, business loans, treasury services, wealth management, and card-related services. For long-term readers, the key point is that this is a traditional bank whose results depend mainly on loan growth, deposit costs, credit quality, and the economic health of Hawaii and the Pacific islands it serves.
Its revenue base is still dominated by net interest income, which is the spread between what the bank earns on loans and securities and what it pays on deposits and other funding. Noninterest income adds a smaller but useful second layer, especially through service charges, card and merchant processing fees, trust and investment services, and mortgage banking. Based on the company’s recent annual disclosures, the mix is approximately:
- Net interest income: about 70% to 75% of total revenue. This mainly comes from commercial and industrial loans, commercial real estate, residential mortgages, consumer lending, and interest earned on the securities portfolio.
- Service charges on deposit accounts: about 6% to 8%. These are fees tied to account activity and banking services.
- Card and other service fees: about 5% to 7%. This includes debit and credit card activity, merchant processing, and related services.
- Trust, investment, and asset management fees: about 4% to 6%. These come from wealth management and fiduciary services.
- Mortgage banking and other noninterest income: about 8% to 12%. This includes gains, servicing-related items, and several smaller revenue streams.
That structure makes First Hawaiian less diversified than national banks, but also easier to understand. The business is built around a strong local deposit franchise and a long operating history in markets with high barriers to entry, especially Hawaii, where scale, branch presence, and customer relationships still matter.
The business mix has remained broadly stable, but profitability has been shaped by changing interest rates. Revenue expanded notably from 2021 through 2025, while interest expense rose sharply during the higher-rate period, compressing part of the benefit. Even so, net income recovered in 2025 after pressure in 2023 and 2024, showing that earnings remain closely tied to funding costs and margin management.
Key Figures
| Metric | Value | Sector ⓘ |
|---|---|---|
| Date | Oct 24, 2026 | |
| Context | ||
| Sector | Financial Services | |
| Industry | Banks - Regional | |
| Market Cap ⓘ | $3.08B | |
| Beta ⓘ | 0.75 | |
Value (Cheapness) | ||
| P/E Ratio ⓘ | 11.01 | 12.46 |
| P/B Ratio ⓘ | 1.14 | 1.25 |
| FCF Yield ⓘ | 10.46% | 9.82% |
| Dividend Yield ⓘ | 4.10% | 2.94% |
| EBIT / EV ⓘ | 9.19% | 8.11% |
| PEG ⓘ | 3.05 | |
Growth (Business expansion) | ||
| Revenue Growth ⓘ | 5.90% | 9.10% |
| RPS Growth (5Y CAGR) ⓘ | 14.20% | 12.31% |
| EPS Growth (5Y CAGR) ⓘ | -14.51% | -6.97% |
| BVPS Growth (5Y CAGR) ⓘ | 1.84% | 5.02% |
| Margin Growth (5Y Trend) ⓘ | -18.90% | -4.00% |
| FCF Growth (5Y CAGR) ⓘ | -6.49% | 4.71% |
| DPS Growth (5Y CAGR) ⓘ | 0.19% | 8.92% |
Quality (Business durability) | ||
| ROIC (Latest) ⓘ | N/A | 9.18% |
| ROE (Latest) ⓘ | 10.25% | 13.93% |
| ROA (Latest) ⓘ | 1.19% | 1.57% |
| ROIC (5Y Median) ⓘ | 9.08% | 7.80% |
| ROE (5Y Median) ⓘ | 9.88% | 12.15% |
| ROA (5Y Median) ⓘ | 1.07% | 1.28% |
| Net Debt / EBIT (Latest) ⓘ | -1.39 | 1.02 |
| Net Debt / EBIT (5Y Median) ⓘ | -3.14 | 0.72 |
| Net Debt / EBITDA (Latest) ⓘ | -1.19 | 0.88 |
| Operating Margin (Latest) ⓘ | 19.43% | 22.30% |
| Operating Margin (5Y Median) ⓘ | 30.32% | 24.50% |
| Debt to Equity (Latest) ⓘ | N/A | 59.34% |
| Profit Margin (Latest) ⓘ | 32.34% | 26.42% |
| Free Cash Flow (Latest) ⓘ | $322.41M | |
Momentum (Price trend) | ||
| 3Y Return ⓘ | +69.43% | +95.73% |
| 12M Return (excl. last month) ⓘ | +3.56% | +17.30% |
| 6M Return ⓘ | -0.52% | +6.07% |
| Price vs. 200-Day MA ⓘ | -0.46% | +5.36% |
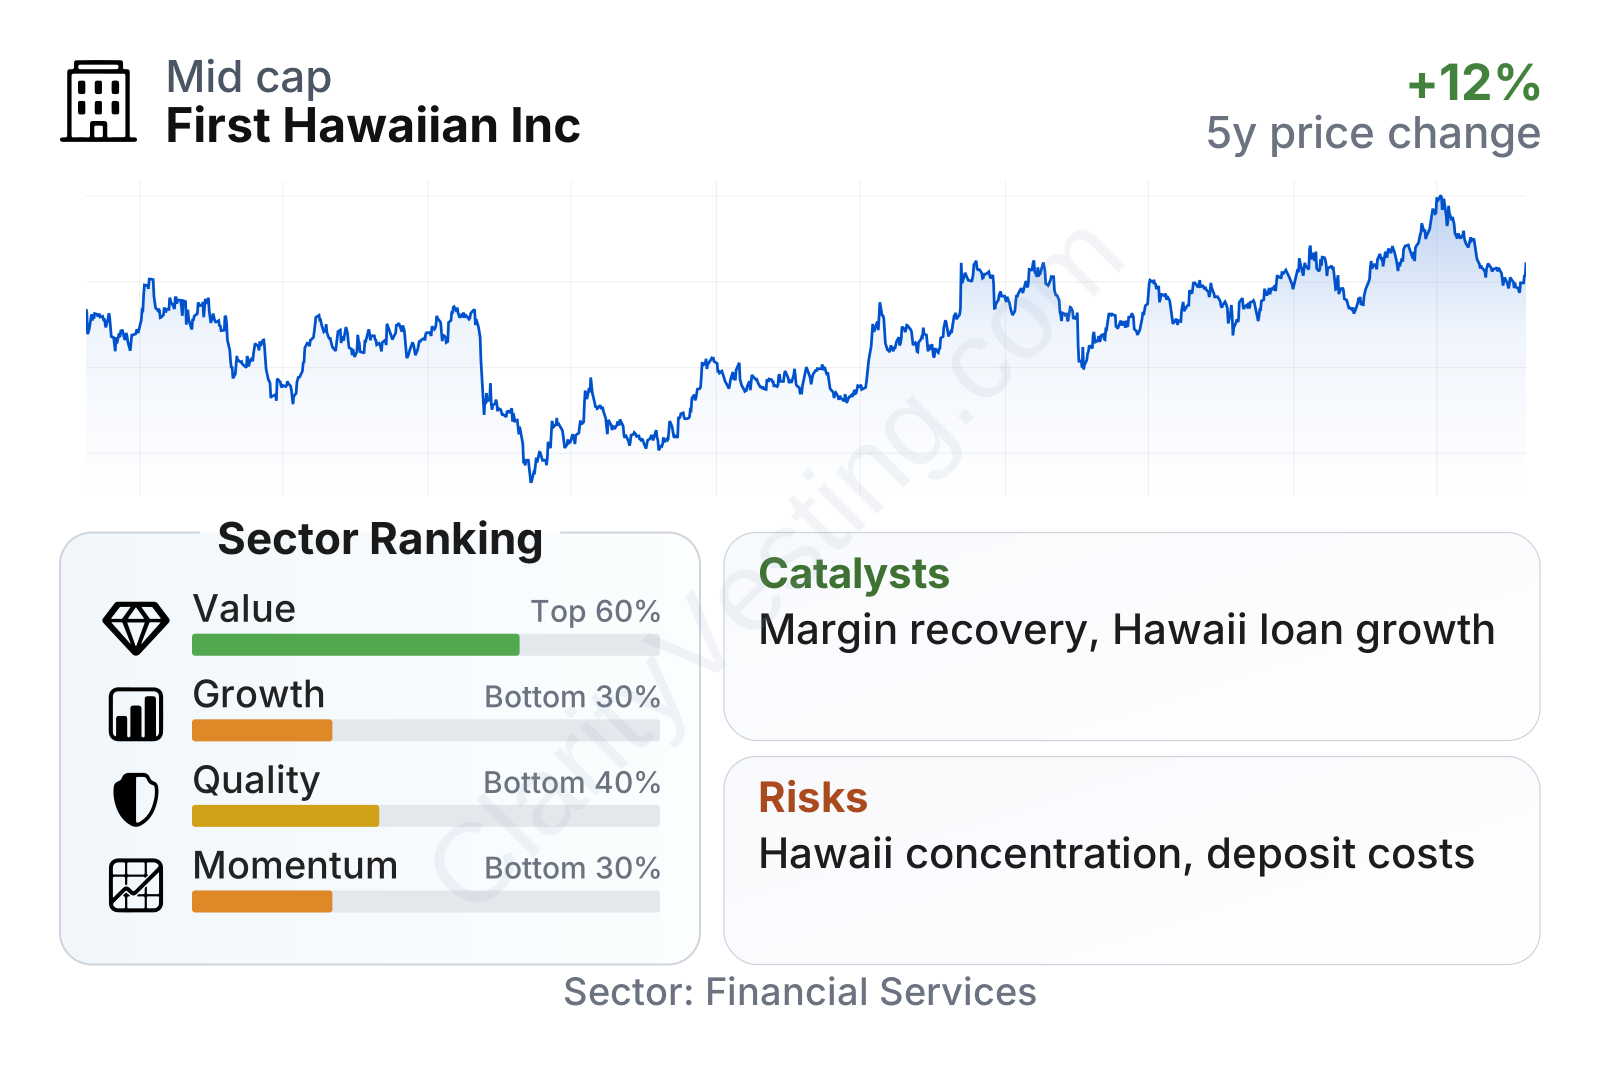
First Hawaiian is a mid-sized regional bank with a relatively low-beta share price, meaning it has historically moved less than the broader market. On valuation, it screens somewhat cheaper than the sector median on both earnings and book value, while its dividend yield stands above the sector median. The weaker side of the picture is growth and momentum: recent price performance has lagged peers, and profitability measures place the bank below the sector median even though absolute profit margin remains solid for a regional bank.
Growth
Banking is not a fast-growth sector in the same way as software or semiconductors, but it remains essential and can compound steadily when a bank has durable deposits, disciplined lending, and room to deepen customer relationships. First Hawaiian operates in a market that tends to be more concentrated and less crowded than many mainland banking markets. That can support stable pricing and customer retention, particularly in Hawaii, where local presence and brand familiarity carry real weight.
The company’s strategy is sensible for this type of market. It emphasizes relationship banking, core deposits, commercial lending, consumer banking, and fee businesses such as wealth management and card services. In practical terms, that means growth does not require dramatic expansion into unfamiliar regions. Instead, it can come from increasing loans within existing markets, improving deposit mix, cross-selling treasury and investment services, and protecting spreads as rate conditions evolve.
Earnings per share show the recent cycle clearly. Results declined from the 2021 level through 2024 as higher funding costs and pressure on profitability weighed on performance, then rebounded in 2025. That pattern matters because it suggests the earnings base is still intact, but also that the company is sensitive to the interest-rate environment. For long-term analysis, the main question is not whether earnings move quarter to quarter, but whether normalized earnings can gradually rise as balance-sheet costs stabilize and the loan book grows.
Book value per share has improved again after the drop in 2022, and by 2025 it moved above the pre-decline level. For banks, book value is an important anchor because it reflects the capital base supporting future lending and earnings. The recovery here is constructive, although the five-year pace has been slower than the sector median, which suggests the company is rebuilding value rather than compounding it at a leading rate.
Recent company updates have also pointed to continued balance-sheet discipline, capital returns through dividends, and ongoing focus on credit quality. A meaningful catalyst for future performance would be a period in which deposit costs level off while asset yields remain healthy. In that setting, net interest margin can improve without requiring aggressive loan growth. Another potential tailwind is Hawaii’s tourism-driven economy remaining resilient, which supports both consumer activity and business borrowing.
Risks
This article is for informational purposes only and does not constitute financial advice. Some content is AI-generated. See Disclaimer


