Stock Analysis · Flight Centre Travel Group Limited (FGETF)
Overview
Flight Centre Travel Group Limited is a global travel retailer and corporate travel manager. The company sells leisure trips to individuals and families, and it also manages business travel for companies, governments, and other organizations. Its model combines human travel advisors, physical stores, call centers, and digital booking tools. That mix matters because travel is a category where some customers still want personal service, especially for complex itineraries, while others prefer online convenience.
Revenue mainly comes from commissions, fees, and other income linked to arranging travel rather than from owning airlines or hotels. Based on the company’s recent annual reporting, corporate travel is the largest earnings engine, while leisure travel remains an important contributor across Australia, New Zealand, the Americas, Europe, South Africa, and Asia.
The business is broadly organized around these main sources of revenue and profit contribution:
- Corporate travel services: approximately 50% to 60% of total transaction value in recent years. This includes business travel booking, account management, travel policy tools, expense-related services, and meetings and events through brands such as FCM.
- Leisure travel services: approximately 35% to 45% of total transaction value. This covers holiday packages, flights, cruises, tours, accommodations, and foreign exchange sold through brands such as Flight Centre and various specialty leisure banners.
- Other travel-related services: typically a smaller share, likely below 10%. This includes areas such as travel experiences, ancillary products, and selected support services depending on region and reporting period.
One important point for readers new to the sector: travel agencies often report revenue differently from many other businesses. A large part of what matters economically is the total value of trips booked for customers, but the company only keeps a smaller portion as actual revenue, usually through commissions and service fees. That means booking volumes can be much larger than reported revenue.
The business has recovered strongly from the pandemic disruption. Over the last several years, sales rebounded sharply, operating profit turned positive again, and net income recovered as travel demand normalized. At the same time, the latest annual numbers show a mature phase of recovery rather than a straight-line boom, with growth slowing versus the immediate post-reopening period.
The overall picture is a business that moved from heavy losses in 2022 to renewed profitability by 2023, then improved further in 2024 and remained profitable in 2025 and 2026. Costs have risen with the recovery, especially selling and administrative expenses tied to staffing and operations, but the company’s earnings base is far healthier than during the crisis years.
Key Figures
| Metric | Value | Sector ⓘ |
|---|---|---|
| Date | Oct 03, 2026 | |
| Context | ||
| Sector | Consumer Cyclical | |
| Industry | Travel Services | |
| Market Cap ⓘ | $1.68B | |
| Beta ⓘ | 0.61 | |
Value (Cheapness) | ||
| P/E Ratio ⓘ | 16.92 | 17.04 |
| P/B Ratio ⓘ | 1.61 | 1.61 |
| FCF Yield ⓘ | 22.08% | 9.02% |
| Dividend Yield ⓘ | 5.07% | 2.75% |
| EBIT / EV ⓘ | N/A | 6.69% |
| PEG ⓘ | 1.06 | |
Growth (Business expansion) | ||
| Revenue Growth ⓘ | -0.70% | 5.60% |
| RPS Growth (5Y CAGR) ⓘ | 27.37% | 9.04% |
| EPS Growth (5Y CAGR) ⓘ | N/A | -17.44% |
| BVPS Growth (5Y CAGR) ⓘ | 6.94% | 5.73% |
| Margin Growth (5Y Trend) ⓘ | 39.68% | -0.26% |
| FCF Growth (5Y CAGR) ⓘ | N/A | 4.91% |
| DPS Growth (5Y CAGR) ⓘ | -24.31% | 10.48% |
Quality (Business durability) | ||
| ROIC (Latest) ⓘ | N/A | 12.38% |
| ROA (Latest) ⓘ | 5.79% | 5.54% |
| ROIC (5Y Median) ⓘ | 6.05% | 10.63% |
| ROA (5Y Median) ⓘ | 2.63% | 5.44% |
| Net Debt / EBIT (Latest) ⓘ | 1.58 | 2.16 |
| Net Debt / EBIT (5Y Median) ⓘ | 0.19 | 2.31 |
| Net Debt / EBITDA (Latest) ⓘ | 0.59 | 1.52 |
| Net Debt / Assets ⓘ | 8.09% | 21.74% |
| EBITDA / Interest ⓘ | 5.44 | 9.06 |
| Operating Margin (Latest) ⓘ | 9.14% | 9.12% |
| Operating Margin (5Y Median) ⓘ | 7.04% | 9.56% |
| Debt to Equity (Latest) ⓘ | 112.68% | 76.18% |
| Profit Margin (Latest) ⓘ | 5.22% | 5.30% |
| Free Cash Flow (Latest) ⓘ | $372.05M | |
Momentum (Price trend) | ||
| 3Y Return ⓘ | -35.14% | +11.77% |
| 12M Return (excl. last month) ⓘ | +24.36% | +0.61% |
| 6M Return ⓘ | -1.25% | +1.32% |
| Price vs. 200-Day MA ⓘ | N/A | -3.47% |
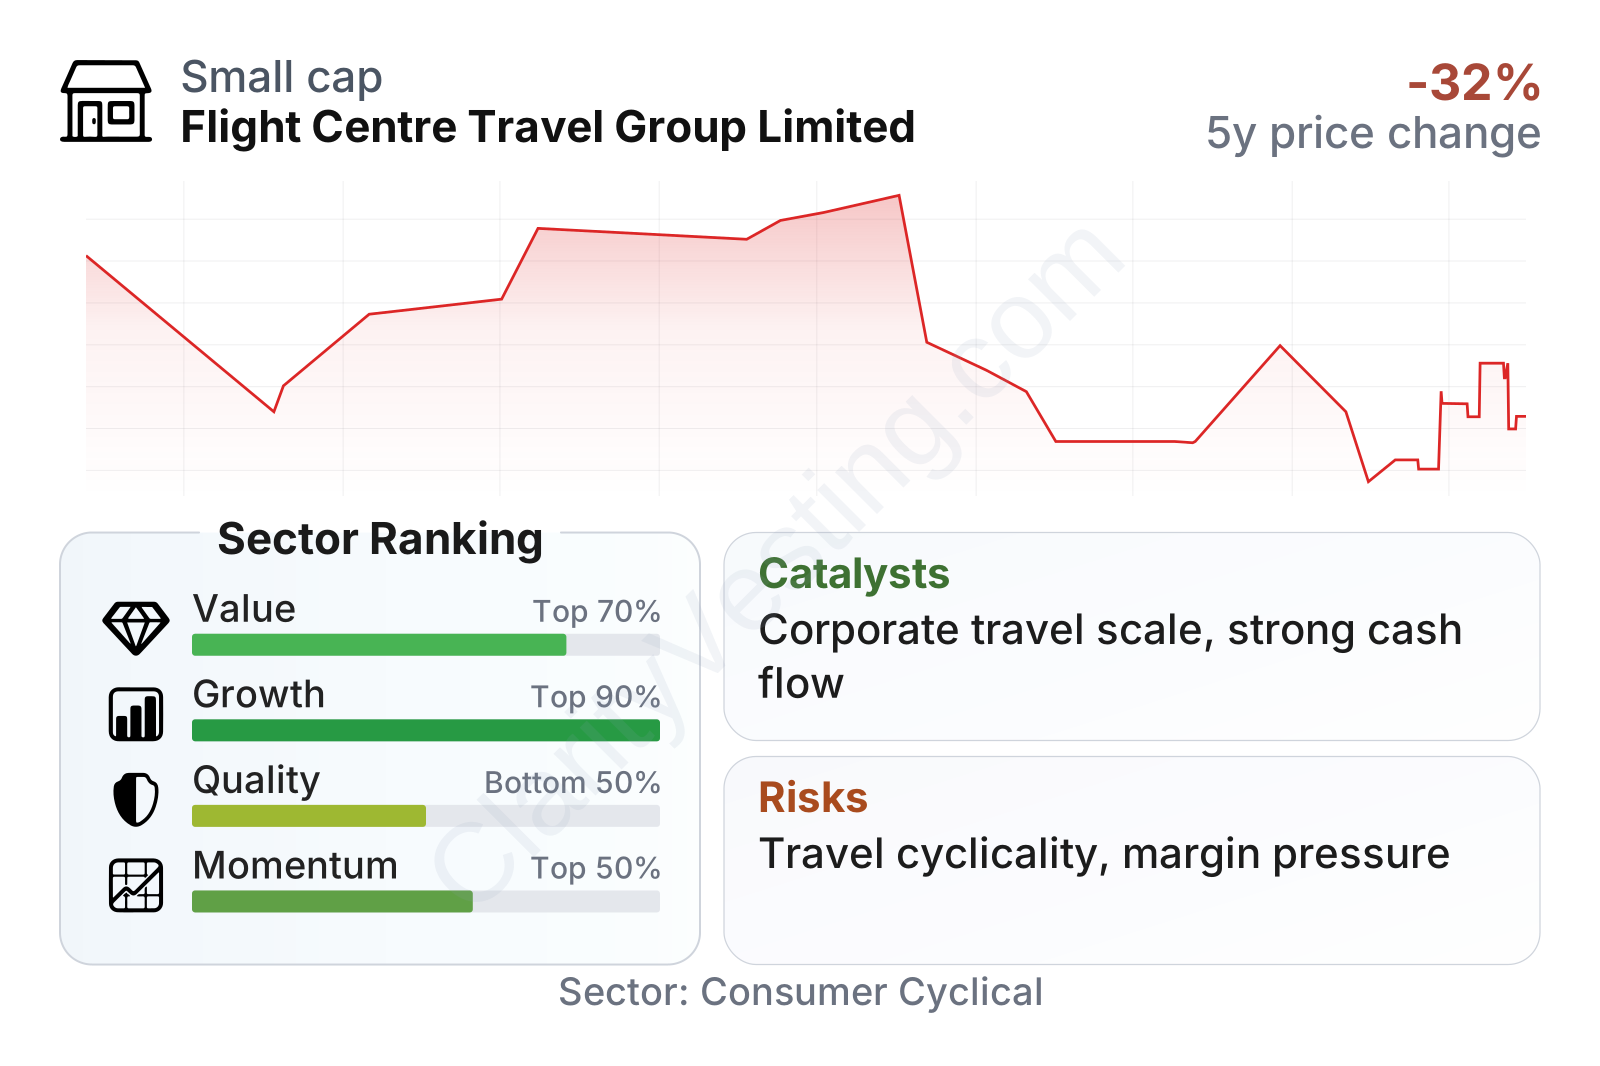
Flight Centre sits in the mid-cap range, with a relatively low share-price volatility profile for a consumer cyclical business. On valuation measures, the stock looks close to sector norms on earnings and book value, while cash generation stands out more favorably: free cash flow yield is well above the sector median, and the dividend yield is also higher than typical peers. Growth metrics are strong over a five-year view because the company has rebounded sharply from depressed pandemic-era levels, but the most recent yearly revenue change was roughly flat to slightly negative, showing that the easy recovery phase may now be behind it. Profitability is mixed rather than exceptional: margins are around sector averages, balance-sheet leverage is manageable on earnings-based debt measures, but debt-to-equity is higher than the sector median.
Growth
Travel services remain a structurally attractive sector over the long run, even though it is cyclical. Global demand for business mobility, international tourism, premium experiences, and blended online-offline booking continues to support the industry. Flight Centre is positioned in several of those areas at once, which is helpful because leisure and corporate travel do not always move in exactly the same way.
The company’s strategy for future growth is sensible. In corporate travel, scale matters because large clients want global reach, service consistency, technology integration, and negotiated supplier relationships. Flight Centre’s FCM brand gives it exposure to that market. In leisure travel, the company still benefits from brand recognition and a network that can handle complex, high-value trips where human advice remains useful. Management has also emphasized productivity, premium leisure, and a blend of physical and digital distribution rather than relying only on storefront expansion.
The growth picture is better over several years than in the latest one-year snapshot. Revenue expanded rapidly from 2022 through 2025 as travel normalized, and operating margins improved materially over that period. More recently, growth appears to have cooled, which is normal after a sharp reopening rebound. For long-term analysis, the more important question is whether Flight Centre can turn a recovery into durable earnings power. So far, positive free cash flow and restored profitability suggest that it has made meaningful progress.
A notable catalyst is the company’s corporate travel platform. Corporate clients are often stickier than leisure customers because travel programs are embedded into internal workflows, approval systems, reporting, and duty-of-care requirements. If business travel volumes keep recovering and companies continue outsourcing travel management, this segment could support steadier margins than pure leisure distribution.
Another catalyst is capital flexibility. The company has rebuilt profits and cash generation, which gives it more room for dividends, technology spending, selective expansion, and balance-sheet support. That does not remove sector cyclicality, but it does improve resilience compared with the pandemic period.
Recent company updates have also pointed to ongoing investment in technology, productivity initiatives, and global account development, especially in corporate travel. Those efforts do not usually create overnight change, but they can strengthen retention and improve efficiency over time.
Risks
This article is for informational purposes only and does not constitute financial advice. Some content is AI-generated. See Disclaimer


