Stock Analysis · F&G Annuities & Life Inc (FG)
Overview
F&G Annuities & Life Inc is a life insurance and retirement-services company focused on protecting savings and generating income for policyholders. Its core products are annuities, which help individuals convert savings into future income, and life insurance products, especially indexed universal life insurance. The company operates through insurance subsidiaries and invests the premiums it receives into a large portfolio of fixed income and other assets in order to earn spread income over time.
Its business model is relatively straightforward at a high level: collect premiums, invest those funds, credit policyholders based on contract terms, and keep the spread after claims, expenses, hedging, and financing costs. This makes F&G more exposed to interest rates, investment performance, surrender behavior, and capital management than a typical industrial company.
Based on recent annual reporting, revenue is primarily tied to annuity and life insurance activity, with investment-related income playing the central economic role. A simple way to think about the company’s earnings drivers is:
- Fixed indexed annuities and other annuity products: the largest source of business volume, likely representing well over 70% of insurance sales activity. These products are designed to offer principal protection with returns linked in part to market indexes, subject to caps, spreads, or participation rates.
- Life insurance, mainly indexed universal life: a smaller but still meaningful business line, likely around 10% to 20% of sales activity depending on the period. These policies combine life coverage with cash value features.
- Institutional and pension risk transfer activity: a modest but strategically important contributor, generally below the core retail annuity franchise but relevant for growth and diversification.
- Net investment income and alternative investment returns: economically critical to profitability, even if accounting presentation does not map neatly to product sales percentages. This includes income from bonds, structured assets, and asset-management relationships tied to the company’s investment platform.
Over the last several years, the income profile has been volatile, which is common in insurance groups with large investment portfolios and market-sensitive liabilities. Revenue expanded materially from 2022 through 2025, but net income did not move in a straight line because hedging, reserve movements, and financing costs can strongly affect reported results from year to year.
The long-term pattern shows a business that has grown revenue meaningfully since 2022, recovered profitability in 2024 after a weak 2023, and then saw earnings compress again in 2025 even as revenue kept rising. That combination suggests scale growth is real, but the path from revenue to bottom-line profit remains uneven.
Key Figures
| Metric | Value | Sector ⓘ |
|---|---|---|
| Date | Oct 24, 2026 | |
| Context | ||
| Sector | Financial Services | |
| Industry | Insurance - Life | |
| Market Cap ⓘ | $2.81B | |
| Beta ⓘ | 1.26 | |
Value (Cheapness) | ||
| P/E Ratio ⓘ | 6.72 | 12.46 |
| P/B Ratio ⓘ | 0.62 | 1.25 |
| FCF Yield ⓘ | 166.95% | 9.82% |
| Dividend Yield ⓘ | 4.91% | 2.94% |
| EBIT / EV ⓘ | 22.97% | 8.11% |
| PEG ⓘ | N/A | |
Growth (Business expansion) | ||
| Revenue Growth ⓘ | 4.20% | 9.10% |
| RPS Growth (5Y CAGR) ⓘ | 7.73% | 12.31% |
| EPS Growth (5Y CAGR) ⓘ | 16.08% | -6.97% |
| BVPS Growth (5Y CAGR) ⓘ | -4.49% | 5.02% |
| Margin Growth (5Y Trend) ⓘ | -38.21% | -4.00% |
| FCF Growth (5Y CAGR) ⓘ | 26.23% | 4.71% |
| DPS Growth (5Y CAGR) ⓘ | -70.54% | 8.92% |
Quality (Business durability) | ||
| ROIC (Latest) ⓘ | 8.06% | 9.18% |
| ROE (Latest) ⓘ | 8.88% | 13.93% |
| ROA (Latest) ⓘ | 0.42% | 1.57% |
| ROIC (5Y Median) ⓘ | 9.94% | 7.80% |
| ROE (5Y Median) ⓘ | 15.27% | 12.15% |
| ROA (5Y Median) ⓘ | 0.82% | 1.28% |
| Net Debt / EBIT (Latest) ⓘ | 0.20 | 1.02 |
| Net Debt / EBIT (5Y Median) ⓘ | 0.20 | 0.72 |
| Net Debt / EBITDA (Latest) ⓘ | 0.10 | 0.88 |
| Operating Margin (Latest) ⓘ | 11.48% | 22.30% |
| Operating Margin (5Y Median) ⓘ | 16.79% | 24.50% |
| Debt to Equity (Latest) ⓘ | 48.58% | 59.34% |
| Profit Margin (Latest) ⓘ | 6.89% | 26.42% |
| Free Cash Flow (Latest) ⓘ | $4.69B | |
Momentum (Price trend) | ||
| 3Y Return ⓘ | -21.92% | +95.73% |
| 12M Return (excl. last month) ⓘ | -30.18% | +17.30% |
| 6M Return ⓘ | -19.38% | +6.07% |
| Price vs. 200-Day MA ⓘ | -16.09% | +5.36% |
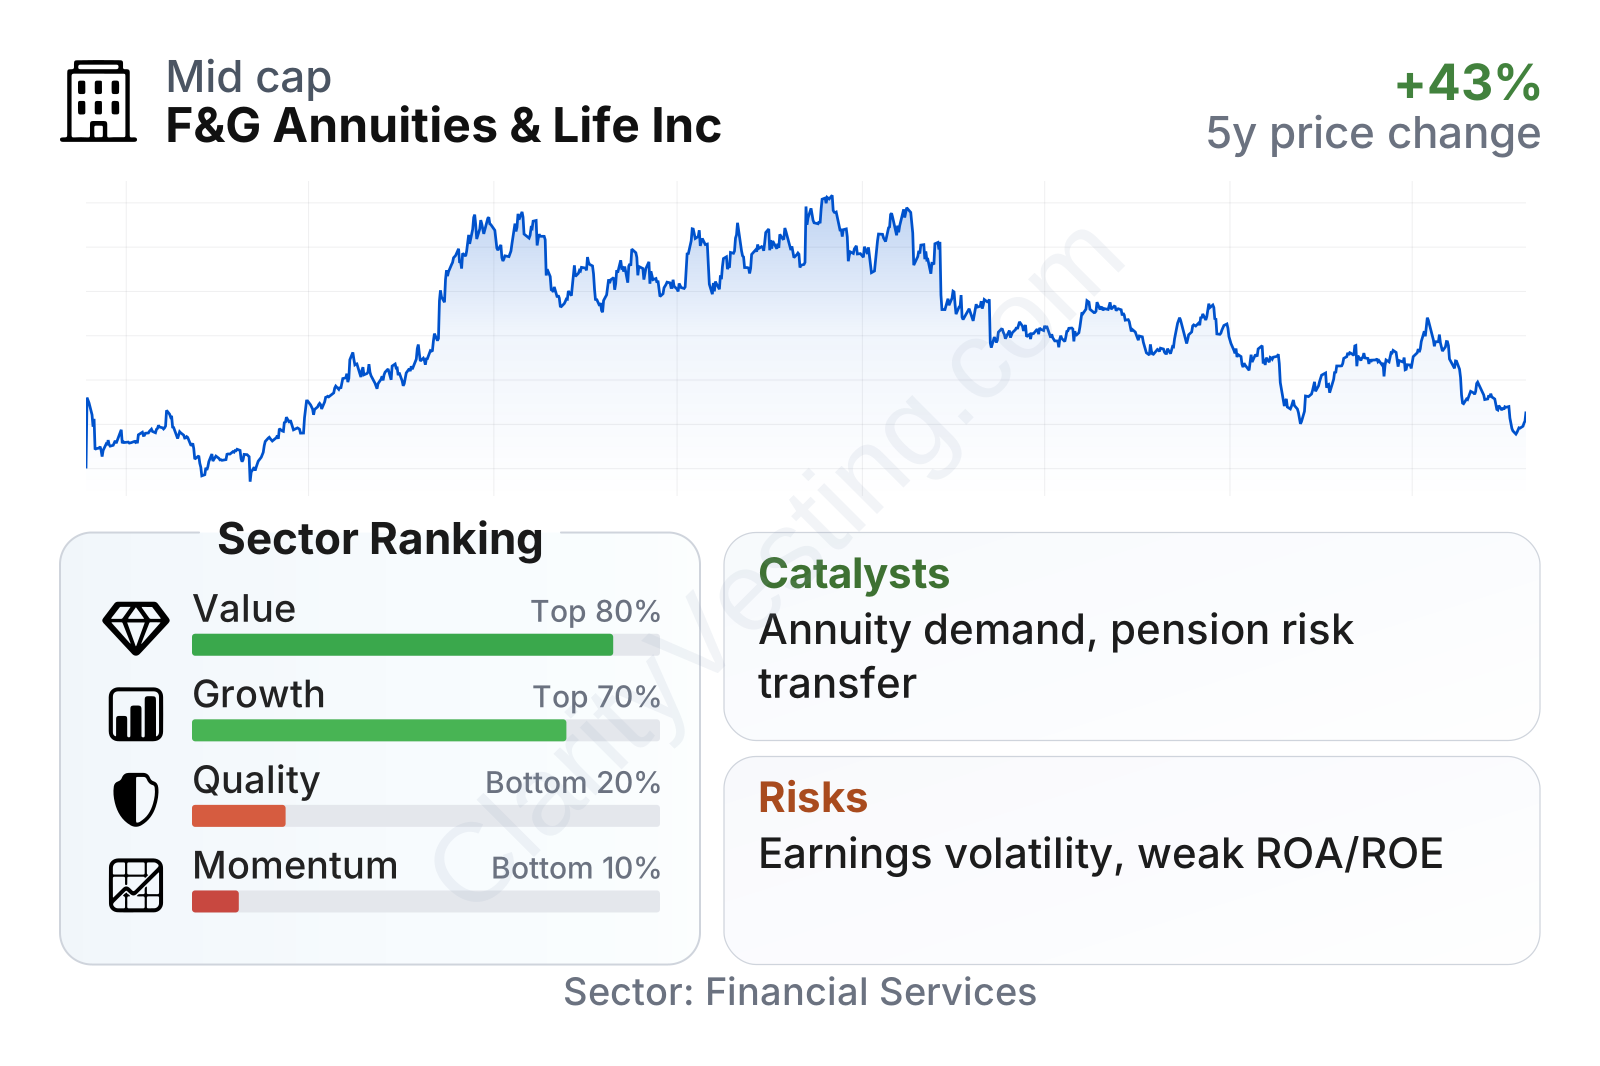
F&G currently screens as inexpensive on several common valuation measures. Its earnings multiple and price-to-book ratio both sit below sector median levels, while dividend yield is above the sector median. At the same time, quality and share-price momentum are weaker than most peers. In practical terms, the market is recognizing low valuation, but it is also discounting inconsistent profitability, lower returns on assets and equity, and a notable decline in the stock over the past year.
The share-price history reinforces that point. After a strong run into late 2024, the stock gave back a large part of those gains through 2025 and into 2026. That retreat has pushed valuation lower, but it also signals that confidence in near-term earnings durability has weakened.
Growth
F&G operates in a part of financial services that still has structural demand. Retirement income remains a major need in the United States as households age, pensions remain limited in the private sector, and savers look for products that can offer a mix of principal protection and income planning. That backdrop supports long-term demand for annuities, especially fixed indexed annuities, which have been gaining attention industrywide in periods of market uncertainty and higher interest rates.
The company’s strategy also fits that environment. F&G has emphasized indexed products, broader distribution, pension risk transfer, and investment capabilities intended to support crediting rates and product competitiveness. In a favorable rate environment, insurers like F&G can often write new business at attractive spreads because yields on invested assets improve faster than older liabilities reset.
Earnings progression shows that the company has been capable of growing profit over a multiyear period, even though annual results have not been smooth. Five-year earnings-per-share growth remains strong compared with much of the sector, which is notable given that many life insurers have struggled to produce steady per-share expansion. The more recent flattening and pullback, however, shows that this is not a simple compounding story; results remain sensitive to market conditions and accounting volatility.
Book value per share is also important for an insurer because it reflects the capital base supporting future business. F&G’s book value recovered strongly after a sharp drop earlier in the period and has been climbing in recent years. That recovery matters because it suggests the balance sheet rebuilt after earlier pressure, even though the full five-year growth rate still looks weak when measured from the earlier, much higher starting point.
A meaningful catalyst is the company’s relationship with Fidelity National Financial, which provides ownership support, access to relationships, and strategic flexibility. Another growth lever is pension risk transfer, where employers shift pension obligations to insurers. This market has expanded as corporations seek to reduce balance-sheet complexity, and it gives F&G an avenue beyond traditional retail annuity distribution.
Recent company communications have also highlighted continued product and distribution development, including reinsurance and institutional activity that can support scale. If industry annuity demand remains elevated and investment spreads stay healthy, F&G has a credible path to further asset and earnings growth.
Risks
This article is for informational purposes only and does not constitute financial advice. Some content is AI-generated. See Disclaimer


