Stock Analysis · Fairfax India Holdings Corporation (FFXDF)
Overview
Fairfax India Holdings Corporation is an investment holding company focused on India. Rather than operating one single business, it allocates capital across a portfolio of Indian companies and assets. The company is managed within the Fairfax group and aims to benefit from India’s long-term economic growth through ownership stakes in sectors such as airports, financial services, retail, logistics, chemicals, and healthcare-related businesses.
Its economic value comes mainly from changes in the value of its investments, dividends and interest received from portfolio companies, and gains realized when assets are sold or revalued. That makes Fairfax India different from a typical operating company: reported revenue and earnings can swing sharply from year to year because accounting results are heavily influenced by fair-value changes.
Based on recent disclosures, the portfolio has been concentrated in a few major holdings, with the largest exposure tied to Bangalore International Airport and other sizable positions in Indian businesses associated with financial services, logistics, and consumer-facing activities. Because Fairfax India is a holding company, a practical way to think about its “sources of revenue” is by economic exposure rather than product sales.
- Bangalore International Airport: the largest asset, representing a substantial share of portfolio value. This includes the airport business and related long-duration infrastructure exposure.
- Financial services and lending-related investments: income can come from dividends, interest, and valuation changes in investee companies.
- Consumer, retail, and distribution businesses: exposure to Indian domestic demand through operating subsidiaries and investee companies.
- Industrial, logistics, and other private investments: smaller positions that can still have an outsized impact on reported earnings when valuations change.
The financial flow also shows how unusual this business can look from one year to the next: operating profitability can appear very strong, but net income can still turn negative or rebound sharply depending on taxes, financing costs, and especially investment valuation movements. That is normal for an investment vehicle, but it requires more attention to net asset value and book value than to conventional sales trends.
The multi-year pattern suggests a business with low corporate overhead relative to asset size, but with very uneven reported revenue and profit because marks on investments and one-off items can dominate the income statement.
Key Figures
| Metric | Value | Sector ⓘ |
|---|---|---|
| Date | Oct 24, 2026 | |
| Context | ||
| Sector | Financial Services | |
| Industry | Asset Management | |
| Market Cap ⓘ | $2.44B | |
| Beta ⓘ | 0.83 | |
Value (Cheapness) | ||
| P/E Ratio ⓘ | 12.19 | 12.46 |
| P/B Ratio ⓘ | 0.65 | 1.25 |
| FCF Yield ⓘ | -1.22% | 9.82% |
| Dividend Yield ⓘ | N/A | 2.94% |
| EBIT / EV ⓘ | N/A | 8.11% |
| PEG ⓘ | N/A | |
Growth (Business expansion) | ||
| Revenue Growth ⓘ | -15.80% | 9.10% |
| RPS Growth (5Y CAGR) ⓘ | -24.76% | 12.31% |
| EPS Growth (5Y CAGR) ⓘ | N/A | -6.97% |
| BVPS Growth (5Y CAGR) ⓘ | 13.25% | 5.02% |
| Margin Growth (5Y Trend) ⓘ | 162.99% | -4.00% |
| FCF Growth (5Y CAGR) ⓘ | N/A | 4.71% |
| DPS Growth (5Y CAGR) ⓘ | N/A | 8.92% |
Quality (Business durability) | ||
| ROIC (Latest) ⓘ | N/A | 9.18% |
| ROE (Latest) ⓘ | 8.08% | 13.93% |
| ROA (Latest) ⓘ | 5.66% | 1.57% |
| ROIC (5Y Median) ⓘ | 9.16% | 7.80% |
| ROE (5Y Median) ⓘ | 13.87% | 12.15% |
| ROA (5Y Median) ⓘ | 10.35% | 1.28% |
| Net Debt / EBIT (Latest) ⓘ | N/A | 1.02 |
| Net Debt / EBIT (5Y Median) ⓘ | 0.25 | 0.72 |
| Net Debt / EBITDA (Latest) ⓘ | 1.29 | 0.88 |
| Operating Margin (Latest) ⓘ | N/A | 22.30% |
| Operating Margin (5Y Median) ⓘ | 95.85% | 24.50% |
| Debt to Equity (Latest) ⓘ | 17.93% | 59.34% |
| Profit Margin (Latest) ⓘ | 43.47% | 26.42% |
| Free Cash Flow (Latest) ⓘ | -$29.80M | |
Momentum (Price trend) | ||
| 3Y Return ⓘ | +41.73% | +95.73% |
| 12M Return (excl. last month) ⓘ | -2.12% | +17.30% |
| 6M Return ⓘ | -3.02% | +6.07% |
| Price vs. 200-Day MA ⓘ | +0.85% | +5.36% |
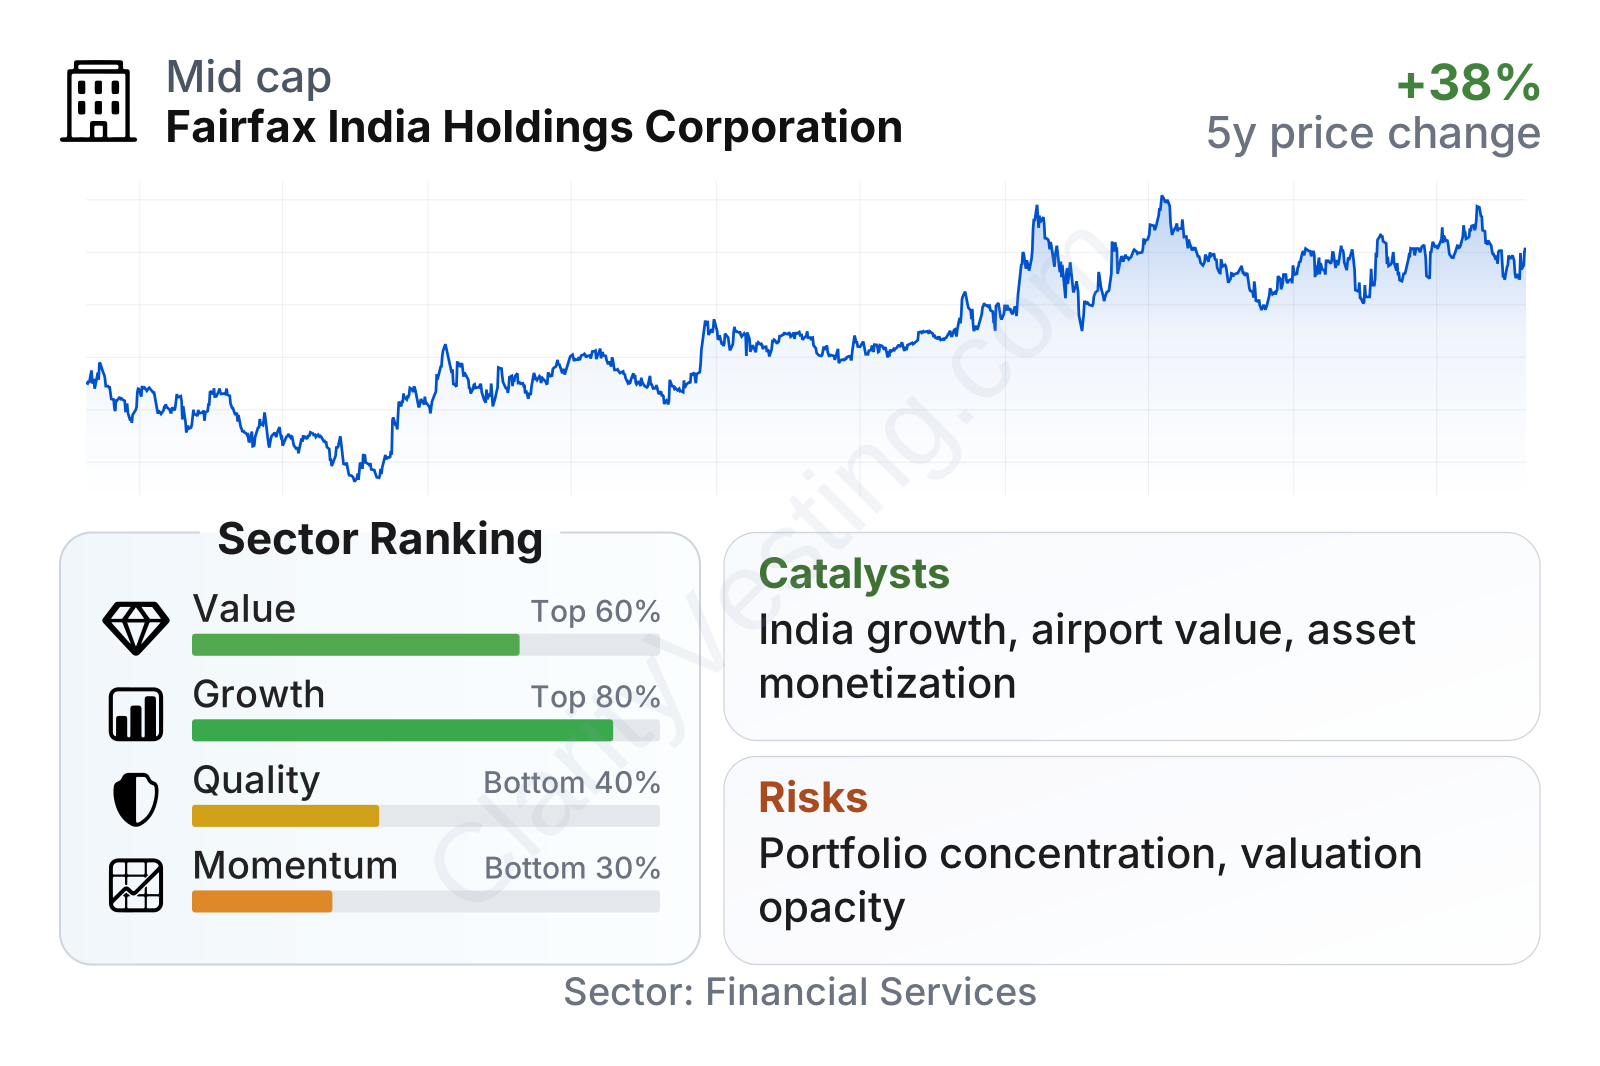
Fairfax India is a mid-sized listed holding company with a beta below 1, which suggests lower share-price sensitivity than the broader market. On valuation, the stock trades near the sector median on earnings but clearly below the sector median on price-to-book. Growth and momentum rankings are weak on recent reported numbers, while quality looks mixed: profitability on assets is strong versus the sector, but return on equity has recently been softer. The combination points to a company whose market price is being driven more by confidence in asset values and future realizations than by smooth operating growth.
The stock-price history also reflects that pattern. After a sharp decline in 2022, the shares recovered and have generally trended upward since 2023, but not in a straight line. That uneven path fits a company whose value depends heavily on periodic reassessments of a concentrated portfolio.
Growth
Fairfax India is tied to one of the most attractive long-term macro themes in global markets: India’s expanding economy, rising middle class, increasing infrastructure needs, and formalization of financial and consumer activity. That backdrop is favorable for assets such as airports, logistics, lending platforms, and consumer-linked businesses. In that sense, the company is positioned in a growing market even if its own reported revenue does not rise steadily every year.
The strategy also has internal logic for long-term growth. Fairfax India does not need all portfolio companies to perform at once. If a few major holdings compound value over time, especially infrastructure and financially scalable assets, the company can grow book value even during periods when accounting earnings are volatile.
Earnings per share have been highly uneven, including a loss in 2024, a strong rebound in 2025, and another negative trailing period into mid-2026. That volatility is not ideal, but it is less surprising for a portfolio company than it would be for a normal operator. The more encouraging point is that profitability has shown the ability to snap back sharply when investment values recover or underlying businesses improve.
Book value per share is the more relevant long-term measure here, and the trend has generally been constructive over the past five years. The five-year compound growth rate in book value per share is around 13%, well above the sector median in the supplied comparison. That matters because book value is a close proxy for underlying portfolio value in this structure.
A major catalyst remains the maturation of core assets. If Bangalore International Airport continues to increase traffic, commercial revenue, and strategic value, it could lift Fairfax India’s net asset value materially over time. Additional upside could come from monetizations, partial sales, or public listings of portfolio companies, which can turn private valuations into observable market prices. Company updates in 2026 have continued to center on portfolio execution and valuation development rather than on building a broad operating platform, which is consistent with the investment-holding model.
Risks
This article is for informational purposes only and does not constitute financial advice. Some content is AI-generated. See Disclaimer


