Stock Analysis · FirstEnergy Corporation (FE)
Overview
FirstEnergy Corporation is a regulated electric utility serving customers mainly in the Midwest and Mid-Atlantic regions of the United States. Its business is centered on delivering electricity through local distribution networks and high-voltage transmission lines rather than relying on fast-changing competitive power markets. That matters for long-term analysis because regulated utilities typically earn returns that are reviewed by state and federal regulators, making their revenue base more predictable than that of many industrial or technology companies.
After several years of simplifying its portfolio, FirstEnergy is now primarily a wires company: it owns electric distribution utilities that deliver power to homes and businesses, and transmission assets that move power across larger regional grids. Based on the company’s recent annual reporting structure and revenue mix, the main sources of revenue are approximately:
- Distribution operations: about 65% to 75% of revenue. This includes retail electric delivery service, regulated charges to residential, commercial, and industrial customers, and related riders approved by regulators.
- Integrated and stand-alone transmission: about 20% to 30% of revenue. This includes regulated transmission service over high-voltage networks and formula-based rates overseen largely at the federal level.
- Corporate and other activities: about 5% to 10% of revenue. This includes support activities and items that do not fit the main utility segments.
The broad trend in recent years has been steady revenue expansion, with total revenue rising from roughly $11 billion in 2021 to about $15 billion in 2025. Operating income has stayed relatively resilient, but net income has been less stable because interest costs, taxes, and one-time items can move results significantly from year to year.
The business mix shows why FirstEnergy can look steadier at the operating level than at the bottom line. Revenue has moved higher over time, and operating income has remained in a fairly narrow range relative to sales, but interest expense still absorbs more than $1 billion a year. That is a key feature of the company’s model: dependable regulated assets, but financed with meaningful leverage.
Key Figures
| Metric | Value | Sector ⓘ |
|---|---|---|
| Date | Oct 03, 2026 | |
| Context | ||
| Sector | Utilities | |
| Industry | Utilities - Regulated Electric | |
| Market Cap ⓘ | $25.25B | |
| Beta ⓘ | 0.44 | |
Value (Cheapness) | ||
| P/E Ratio ⓘ | 23.46 | 16.80 |
| P/B Ratio ⓘ | 2.19 | 1.48 |
| FCF Yield ⓘ | 6.25% | 0.64% |
| Dividend Yield ⓘ | 4.18% | 3.91% |
| EBIT / EV ⓘ | 5.41% | 5.01% |
| PEG ⓘ | 1.45 | |
Growth (Business expansion) | ||
| Revenue Growth ⓘ | 8.80% | 6.00% |
| RPS Growth (5Y CAGR) ⓘ | 6.38% | 4.14% |
| EPS Growth (5Y CAGR) ⓘ | -16.70% | -11.39% |
| BVPS Growth (5Y CAGR) ⓘ | 4.84% | 4.29% |
| Margin Growth (5Y Trend) ⓘ | -5.68% | 3.55% |
| FCF Growth (5Y CAGR) ⓘ | N/A | -9.10% |
| DPS Growth (5Y CAGR) ⓘ | 3.11% | 4.51% |
Quality (Business durability) | ||
| ROIC (Latest) ⓘ | 7.62% | 6.53% |
| ROA (Latest) ⓘ | 1.90% | 3.19% |
| ROIC (5Y Median) ⓘ | 5.83% | 6.12% |
| ROA (5Y Median) ⓘ | 1.94% | 2.76% |
| Net Debt / EBIT (Latest) ⓘ | 9.86 | 7.15 |
| Net Debt / EBIT (5Y Median) ⓘ | 9.60 | 7.24 |
| Net Debt / EBITDA (Latest) ⓘ | 6.19 | 4.40 |
| Net Debt / Assets ⓘ | 49.67% | 39.16% |
| EBITDA / Interest ⓘ | 3.76 | 4.41 |
| Operating Margin (Latest) ⓘ | 18.53% | 20.93% |
| Operating Margin (5Y Median) ⓘ | 19.22% | 20.18% |
| Debt to Equity (Latest) ⓘ | 224.07% | 140.88% |
| Profit Margin (Latest) ⓘ | 6.94% | 11.32% |
| Free Cash Flow (Latest) ⓘ | $1.58B | |
Momentum (Price trend) | ||
| 3Y Return ⓘ | +43.59% | +48.75% |
| 12M Return (excl. last month) ⓘ | +9.36% | +11.24% |
| 6M Return ⓘ | -12.73% | -3.69% |
| Price vs. 200-Day MA ⓘ | -7.30% | -1.97% |
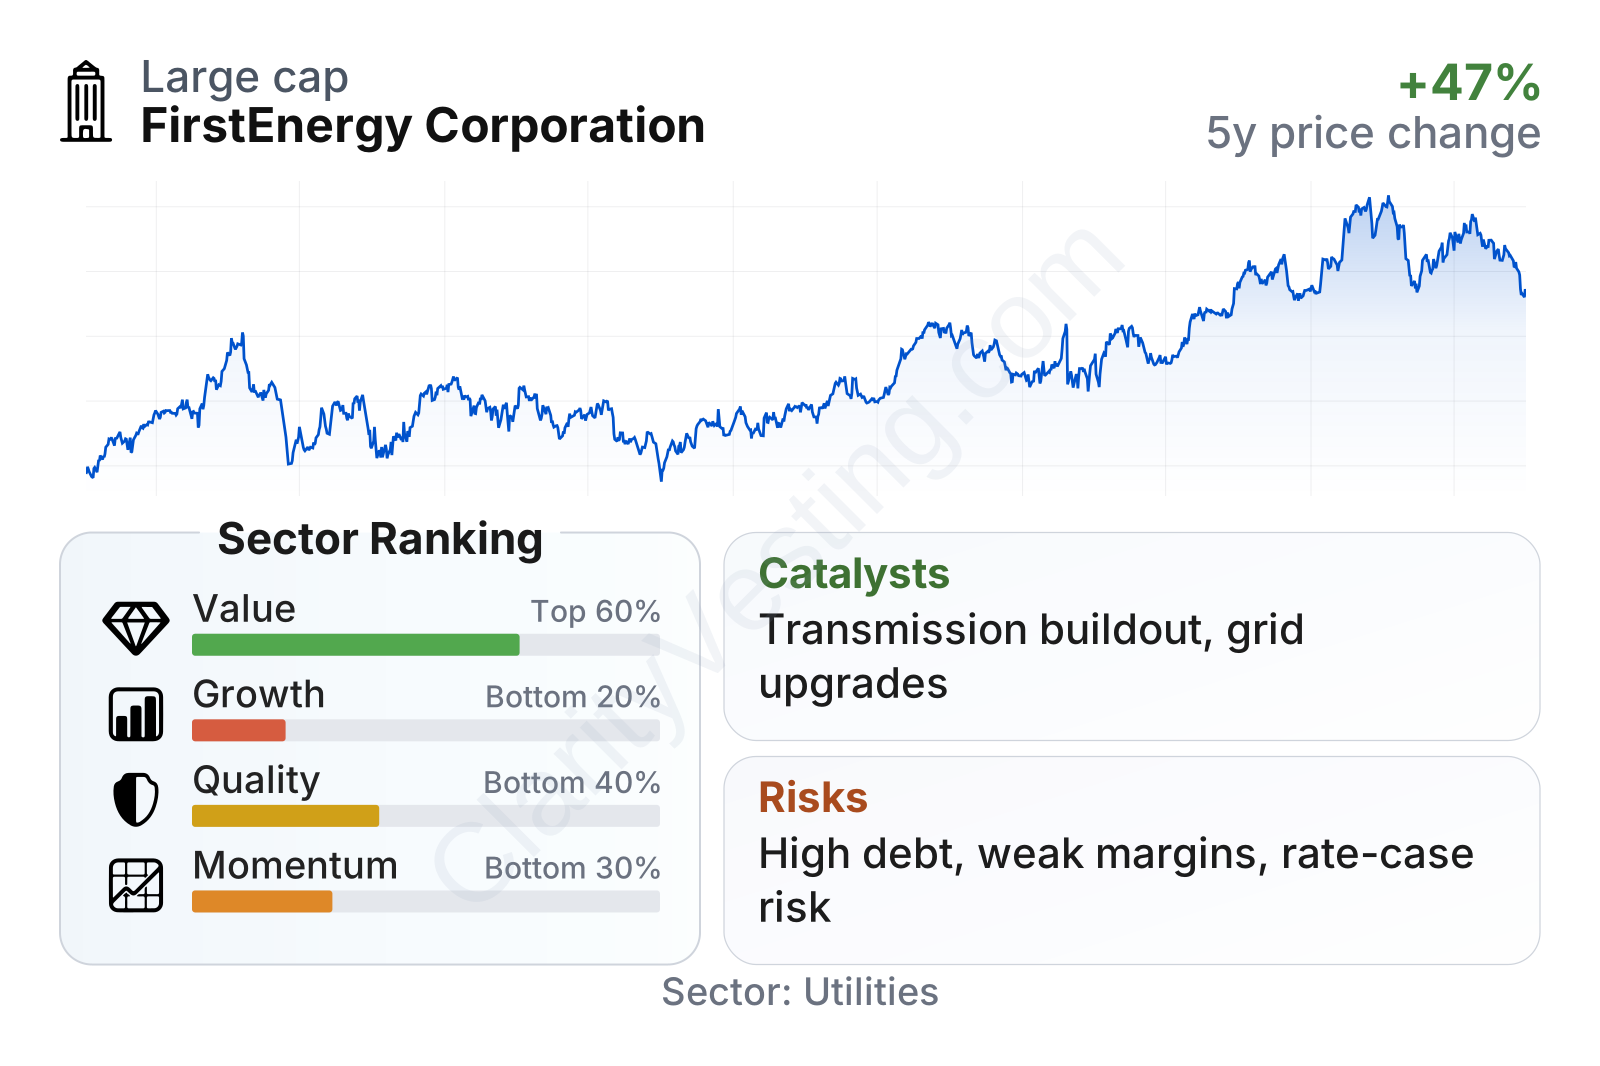
FirstEnergy is a large-cap utility with a notably low beta of about 0.44, which fits the typical defensive profile of regulated electric companies. On valuation, it screens above the sector median on P/E and price-to-book, so the market is assigning a premium despite only modest growth characteristics. At the same time, free cash flow yield looks strong and the dividend yield is slightly above the sector median, which helps offset some of that premium. The weaker areas are growth, balance-sheet strength, and recent share-price momentum compared with many utility peers.
The stock chart shows a recovery from the lower levels seen in 2023, followed by a strong run into 2026 and then some cooling. That pattern suggests the market has already re-rated the shares upward as confidence improved, which is important context when judging valuation today.
Growth
Electric utilities are not high-growth businesses, but they operate in a sector with long-duration demand drivers. Grid modernization, resilience spending, replacement of aging infrastructure, data-center power demand, electrification of transport and heating, and the need to connect new generation all support ongoing investment. For companies like FirstEnergy, growth usually comes less from unit sales volume and more from expanding the regulated asset base on which approved returns are earned.
That strategy makes sense for FirstEnergy. Management has been emphasizing transmission investment, distribution upgrades, storm hardening, and reliability projects across its service territories. Transmission is especially attractive because returns are often set under formula-based mechanisms and can provide clearer visibility than some state-regulated distribution businesses. For a utility, this can be a strong long-term catalyst because capital spending today can support earnings growth over many years if regulators continue to approve recovery.
Revenue per share has been moving upward over the last five years, rising from about $20 to more than $26. That is a solid sign that the company’s regulated growth plan is translating into a larger revenue base on a per-share basis, even though earnings have not advanced as smoothly.
Free cash flow has been volatile, which is common for utilities during heavy investment cycles. FirstEnergy moved from negative free cash flow in earlier periods to strongly positive territory more recently, at around $1.8 billion on a trailing basis. That swing matters because it suggests the cash profile can improve meaningfully when the timing of capital spending, working capital, and regulatory recovery becomes more favorable.
Recent company communication has continued to highlight multi-year capital programs and transmission development as central priorities. In practical terms, the most meaningful opportunity is not a sudden breakthrough product or a new market, but the possibility of steady rate-base expansion supported by reliability needs and rising grid investment across the regions it serves.
Risks
This article is for informational purposes only and does not constitute financial advice. Some content is AI-generated. See Disclaimer


