Stock Analysis · Four Corners Property Trust Inc (FCPT)
Overview
Four Corners Property Trust Inc. is a real estate investment trust, or REIT, that owns restaurant and retail properties and leases them to tenants under long-term net lease agreements. In a net lease structure, the tenant typically pays property taxes, insurance, and maintenance, which helps make the landlord’s cash flow more predictable. FCPT was originally created through a separation from Darden Restaurants and has since expanded into a broader portfolio of properties leased to many different operators.
The company’s business is straightforward: it acquires properties, rents them out, collects contractual rent, and aims to grow by adding new sites while keeping occupancy high. Its portfolio is mainly focused on restaurant real estate, but it has also increased exposure to other retail categories. Because REITs must distribute most of their taxable income, FCPT is often assessed through rental income stability, property acquisition discipline, debt management, and dividend growth rather than through rapid earnings expansion.
Revenue comes primarily from rental income generated by its property portfolio. Based on recent company disclosures, the mix is still heavily tilted toward restaurants, with Darden-related brands remaining the largest tenant exposure, although the portfolio is now much more diversified than it was at inception.
- Restaurant properties: approximately 80% to 90% of annual rent. This includes casual dining, quick-service, and other restaurant formats operated by national and regional brands.
- Retail properties outside restaurants: approximately 10% to 20% of annual rent. This generally includes service-oriented and necessity-oriented retail categories that can fit the same net lease model.
- Largest tenant group, Darden brands: still a major component of rent, but no longer dominant to the extent seen at the company’s formation. Olive Garden is typically the single largest brand exposure, with LongHorn Steakhouse also meaningful.
Over the last several years, the business has shown a clear pattern: revenue and operating income have increased steadily as FCPT kept acquiring additional properties. Margins have remained strong, which is typical for a scaled net lease REIT, although interest expense has also risen as the company financed growth in a higher-rate environment.
The flow of income has generally moved in the right direction, with revenue, operating profit, and net income all trending upward over time. The main offset is financing cost: interest expense has increased meaningfully, which matters for a REIT whose expansion depends on access to debt and equity capital.
Key Figures
| Metric | Value | Sector ⓘ |
|---|---|---|
| Date | Oct 17, 2026 | |
| Context | ||
| Sector | Real Estate | |
| Industry | REIT - Retail | |
| Market Cap ⓘ | $2.35B | |
| Beta ⓘ | 0.82 | |
Value (Cheapness) | ||
| P/E Ratio ⓘ | 19.45 | 17.38 |
| P/B Ratio ⓘ | 1.48 | 0.85 |
| FCF Yield ⓘ | 8.29% | 7.38% |
| Dividend Yield ⓘ | 6.79% | 4.85% |
| EBIT / EV ⓘ | 4.65% | 3.78% |
| PEG ⓘ | N/A | |
Growth (Business expansion) | ||
| Revenue Growth ⓘ | 7.70% | 5.30% |
| RPS Growth (5Y CAGR) ⓘ | 2.44% | 6.02% |
| EPS Growth (5Y CAGR) ⓘ | -12.42% | -11.37% |
| BVPS Growth (5Y CAGR) ⓘ | 5.98% | 0.45% |
| Margin Growth (5Y Trend) ⓘ | -2.87% | -0.22% |
| FCF Growth (5Y CAGR) ⓘ | 11.95% | 5.40% |
| DPS Growth (5Y CAGR) ⓘ | 2.62% | 5.02% |
Quality (Business durability) | ||
| ROIC (Latest) ⓘ | 5.99% | 5.69% |
| ROE (Latest) ⓘ | 7.52% | 7.56% |
| ROA (Latest) ⓘ | 4.07% | 2.85% |
| ROIC (5Y Median) ⓘ | 6.22% | 4.22% |
| ROE (5Y Median) ⓘ | 7.98% | 6.03% |
| ROA (5Y Median) ⓘ | 4.10% | 2.44% |
| Net Debt / EBIT (Latest) ⓘ | 7.23 | 7.59 |
| Net Debt / EBIT (5Y Median) ⓘ | 7.47 | 8.40 |
| Net Debt / EBITDA (Latest) ⓘ | 5.27 | 5.27 |
| Net Debt / Assets ⓘ | 41.21% | 37.76% |
| EBITDA / Interest ⓘ | 1.82 | 4.10 |
| Operating Margin (Latest) ⓘ | 55.75% | 35.29% |
| Operating Margin (5Y Median) ⓘ | 56.00% | 37.31% |
| Debt to Equity (Latest) ⓘ | 77.63% | 88.87% |
| Profit Margin (Latest) ⓘ | 38.70% | 19.61% |
| Free Cash Flow (Latest) ⓘ | $194.79M | |
Momentum (Price trend) | ||
| 3Y Return ⓘ | +18.52% | +30.75% |
| 12M Return (excl. last month) ⓘ | -1.62% | +4.36% |
| 6M Return ⓘ | -10.38% | -2.52% |
| Price vs. 200-Day MA ⓘ | -8.90% | -2.34% |
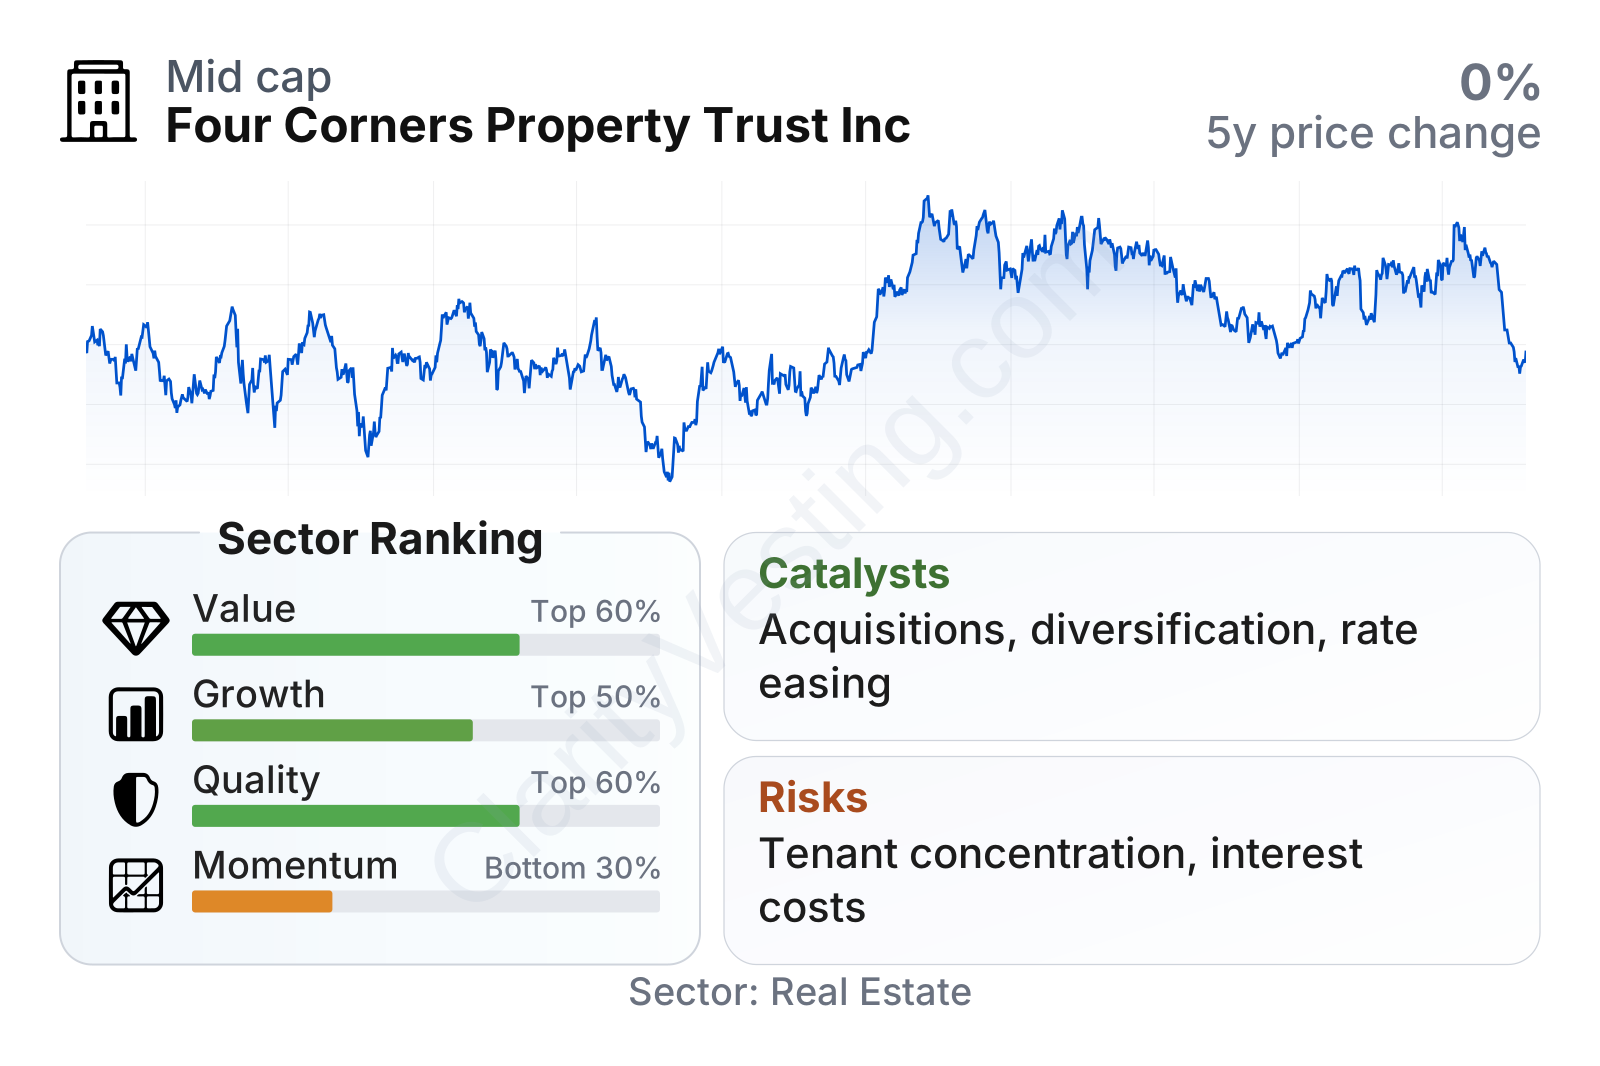
FCPT is a mid-sized retail REIT with a relatively low beta of about 0.8, meaning its share price has tended to fluctuate less than the broader stock market. On value metrics, the picture is mixed: the dividend yield is above the sector median at roughly 6.6%, free cash flow yield is also somewhat stronger than the median, but the price-to-book ratio sits above the sector norm. Quality measures are generally solid, with profitability and returns on assets ahead of many peers. Growth is respectable rather than fast, and recent market momentum has been weaker than the sector, suggesting the shares have not participated as strongly in the latest REIT moves.
Growth
FCPT operates in a mature but still relevant segment of real estate: net lease properties. This is not a high-growth industry in the way technology or biotech can be, but it can still compound steadily when a company has access to acquisition opportunities, disciplined underwriting, and tenants that keep paying rent through different economic cycles. The long-term appeal of the sector is its relatively visible cash flow and the ability to scale through repeatable property purchases.
FCPT’s strategy makes sense for this model. The company has continued broadening beyond its original Darden concentration by buying properties leased to a wider group of restaurant and retail tenants. That diversification matters because it reduces dependence on any single operator and can make cash flow more resilient. Management has also focused on properties with unit-level relevance to tenants, especially locations tied to everyday consumer activity rather than highly discretionary formats.
Revenue per share has edged higher over the past five years, but the pace has been modest, roughly in the low-single-digit range annually. That suggests growth has been steady but partly diluted by capital raising used to fund acquisitions, which is common in REITs. It is a positive sign that the metric kept moving upward, but it also shows this is a gradual compounding business rather than a rapid expansion case.
Dividend per share has also increased over time, again at a measured pace. That fits the profile of a net lease REIT trying to balance growth investments with cash distributions. For a long-term view, the key point is not rapid dividend expansion, but whether rent collections remain dependable and whether acquisitions continue adding enough income to support further increases.
A meaningful catalyst for FCPT is the ongoing fragmentation of restaurant real estate. Many operators and developers still monetize properties through sale-leaseback transactions, giving net lease REITs a recurring pipeline of deals. If capital markets remain open and acquisition pricing stays rational, FCPT can continue growing through bolt-on purchases. Another potential support is any easing in interest rates, which can improve property values, reduce financing pressure, and make REIT cash flows more attractive compared with bonds.
Recent company updates have also highlighted continued acquisition activity and portfolio expansion. That does not guarantee faster growth, but it reinforces that FCPT still has room to scale within its niche. The broader opportunity is not based on one transformative event; it is based on repeating a disciplined acquisition model across a very large market of net lease properties.
Risks
This article is for informational purposes only and does not constitute financial advice. Some content is AI-generated. See Disclaimer


