Stock Analysis · First Commonwealth Financial (FCF)
Overview
First Commonwealth Financial is a regional bank holding company headquartered in Pennsylvania. Through First Commonwealth Bank, it provides everyday banking services to consumers, small businesses, and commercial clients. Its footprint is centered in Pennsylvania and Ohio, and its business model is straightforward: gather deposits, make loans, earn the spread between lending yields and funding costs, and add fee income from payments and advisory services.
Revenue mainly comes from two broad streams: net interest income and noninterest income. In a regional bank like First Commonwealth, net interest income is the dominant source because lending is the core activity. Based on the company’s recent annual results, the mix appears to be approximately:
- Net interest income: about 75% to 85% of total revenue. This is the income earned from loans and securities after paying interest on deposits and borrowings.
- Noninterest income: about 15% to 25% of total revenue. This includes wealth management and trust services, card-related fees, service charges on deposit accounts, insurance commissions, mortgage banking, and other banking fees.
Within lending, the largest exposures are typically commercial real estate, commercial and industrial lending, residential real estate, and consumer loans. On the funding side, customer deposits are the key raw material of the business, making deposit retention and pricing especially important for profitability.
The recent revenue path shows that the bank has expanded its top line meaningfully since 2021, but the cost of funding also rose sharply as interest rates moved higher. That combination matters because it explains why revenue growth has not translated into equally strong growth in earnings.
The long-term picture is one of a larger revenue base with more pressure from interest expense and operating costs than a few years ago. Net income has remained positive and fairly steady, but margin conversion has become less favorable than the headline revenue growth alone would suggest.
Key Figures
| Metric | Value | Sector ⓘ |
|---|---|---|
| Date | Oct 10, 2026 | |
| Context | ||
| Sector | Financial Services | |
| Industry | Banks - Regional | |
| Market Cap ⓘ | $2.01B | |
| Beta ⓘ | 0.75 | |
Value (Cheapness) | ||
| P/E Ratio ⓘ | 12.18 | 12.38 |
| P/B Ratio ⓘ | 1.30 | 1.23 |
| FCF Yield ⓘ | 8.92% | 10.23% |
| Dividend Yield ⓘ | 2.74% | 3.01% |
| EBIT / EV ⓘ | 5.51% | 8.08% |
| PEG ⓘ | 1.46 | |
Growth (Business expansion) | ||
| Revenue Growth ⓘ | 9.60% | 9.50% |
| RPS Growth (5Y CAGR) ⓘ | 13.91% | 12.21% |
| EPS Growth (5Y CAGR) ⓘ | -13.25% | -9.62% |
| BVPS Growth (5Y CAGR) ⓘ | 6.69% | 4.98% |
| Margin Growth (5Y Trend) ⓘ | -15.95% | -4.07% |
| FCF Growth (5Y CAGR) ⓘ | 2.64% | 4.76% |
| DPS Growth (5Y CAGR) ⓘ | 4.15% | 8.79% |
Quality (Business durability) | ||
| ROIC (Latest) ⓘ | 5.02% | 9.35% |
| ROE (Latest) ⓘ | 10.82% | 13.91% |
| ROA (Latest) ⓘ | 1.37% | 1.53% |
| ROIC (5Y Median) ⓘ | 12.02% | 7.86% |
| ROE (5Y Median) ⓘ | 11.86% | 12.22% |
| ROA (5Y Median) ⓘ | 1.32% | 1.29% |
| Net Debt / EBIT (Latest) ⓘ | 1.31 | 0.99 |
| Net Debt / EBIT (5Y Median) ⓘ | 1.76 | 0.73 |
| Net Debt / EBITDA (Latest) ⓘ | 1.23 | 0.93 |
| Operating Margin (Latest) ⓘ | 18.78% | 22.19% |
| Operating Margin (5Y Median) ⓘ | 31.53% | 24.30% |
| Debt to Equity (Latest) ⓘ | 16.76% | 60.24% |
| Profit Margin (Latest) ⓘ | 33.20% | 26.49% |
| Free Cash Flow (Latest) ⓘ | $179.07M | |
Momentum (Price trend) | ||
| 3Y Return ⓘ | +79.23% | +88.52% |
| 12M Return (excl. last month) ⓘ | +22.42% | +19.65% |
| 6M Return ⓘ | +9.50% | +6.00% |
| Price vs. 200-Day MA ⓘ | +5.65% | +3.61% |
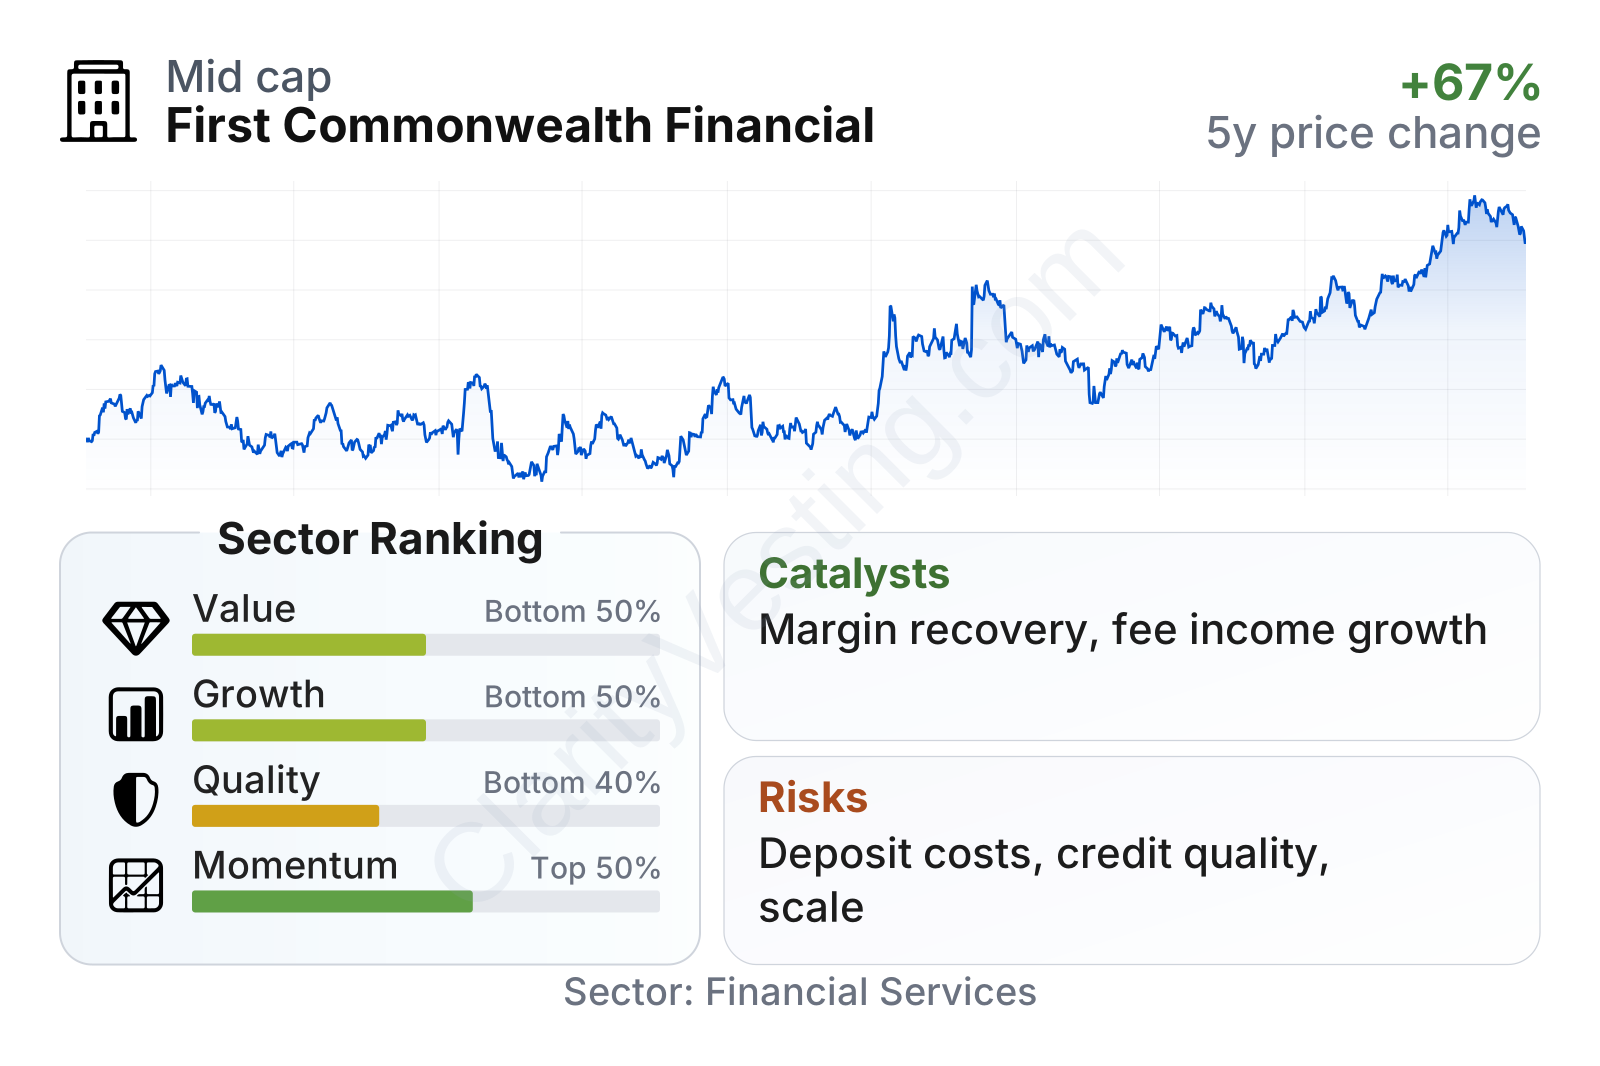
First Commonwealth is a mid-sized regional bank with a market value a little above $2 billion and a below-market beta, which points to lower share-price volatility than many stocks. On valuation, its earnings multiple sits close to the sector median, while its price-to-book ratio is modestly above the sector median. That combination suggests the market is not assigning a deep discount, but it is also not pricing the bank like a premium growth franchise.
The factor breakdown is mixed. Value ranks in the lower half of the sector, largely because the valuation is near average rather than clearly cheap. Quality also sits below many peers, reflecting returns on equity and assets that currently trail sector medians. Growth is held back by weak earnings compounding over five years and a softer margin trend, even though revenue per share and book value per share have grown better than many peers. Momentum is stronger, with recent share-price performance running ahead of the sector median.
Growth
Regional banking is not a fast-growth industry in the way software or semiconductors can be, but it remains a structurally important sector because households and businesses still need local deposits, loans, treasury services, and advice. Growth usually comes from expanding loan balances, gathering low-cost deposits, winning commercial relationships, cross-selling fee services, and making selective acquisitions.
For First Commonwealth, that strategy is sensible. The bank has built a presence in contiguous markets where it can deepen local relationships rather than chase national scale. That approach can work well when credit discipline is maintained and when the bank can defend deposit relationships against larger competitors. The additional attraction is that community and regional banks can still gain share in small-business banking and specialized commercial niches if service quality is strong.
Earnings per share have been uneven over the past several years rather than steadily compounding upward. There was a clear rebound in 2023, a dip in 2024, and some recovery afterward. That pattern fits the broader banking backdrop: strong loan yields helped revenue, but higher deposit costs and funding pressure limited the benefit. For a long-term reading, this makes First Commonwealth more of an earnings-normalization case than a clean high-growth case.
Book value per share has moved upward over time, which is an encouraging sign for a bank because book value often reflects the accumulation of retained earnings and balance-sheet resilience. The five-year compound growth rate is above the sector median, indicating that underlying capital value has been building at a healthy pace even though earnings growth has been less consistent.
A practical catalyst for future growth is the possibility of margin improvement if deposit costs stabilize more quickly than asset yields fall. Another catalyst is continued expansion in fee-based businesses such as wealth management, trust, insurance, and payments, which can make revenue less dependent on interest-rate swings. If the company continues to grow commercial relationships in Pennsylvania and Ohio while preserving credit quality, that would support both revenue durability and franchise strength.
Recent company updates have also pointed to ongoing balance-sheet management, deposit gathering, and commercial banking execution as key priorities. For a regional bank, those are the right levers: they do not create dramatic overnight change, but they can steadily improve profitability if managed well.
Risks
This article is for informational purposes only and does not constitute financial advice. Some content is AI-generated. See Disclaimer