Stock Analysis · FB Financial Corp (FBK)
Overview
FB Financial Corp is a regional banking company headquartered in Tennessee and operating primarily through FirstBank. Its business is centered on traditional banking: gathering deposits from consumers and businesses, making loans, and earning the spread between what it receives on loans and securities and what it pays for funding. It also generates fee income from services such as mortgage banking, wealth and trust activities, deposit account fees, and other banking-related charges.
The company’s revenue mix is still led by net interest income, which is the core profit engine for most regional banks. Based on recent annual results and segment disclosures, the main sources of revenue can be summarized as follows:
- Net interest income: approximately 70% to 80% of total revenue in recent years. This includes interest earned on commercial loans, commercial real estate, residential mortgages, consumer loans, and investment securities, minus interest paid on deposits and other borrowings.
- Mortgage banking income: approximately 5% to 10%. This generally includes gains on mortgage loan sales, servicing-related items, and fees tied to home lending activity.
- Service charges and fees on deposit accounts: approximately 3% to 6%. These are fees connected to checking, savings, treasury management, and related account services.
- Wealth management, trust, and other fee income: approximately 5% to 10%. This bucket typically includes fiduciary, advisory, card-related, and other non-interest banking fees.
- Securities gains and other items: usually a small and more variable share. These can move meaningfully from year to year but are not the main earnings driver.
FB Financial remains a fairly straightforward regional bank rather than a highly diversified financial conglomerate. That simplicity can help readability for long-term analysis: the biggest questions are loan growth, deposit costs, credit quality, and whether management can keep expanding profitably in its Southeastern markets.
The business has expanded revenue meaningfully over the last several years, but that growth has not fully flowed through to net income. Higher interest expense and rising operating costs have absorbed part of the benefit, which is important when judging how durable future earnings growth may be.
Key Figures
| Metric | Value | Sector ⓘ |
|---|---|---|
| Date | Oct 19, 2026 | |
| Context | ||
| Sector | Financial Services | |
| Industry | Banks - Regional | |
| Market Cap ⓘ | $2.55B | |
| Beta ⓘ | 0.97 | |
Value (Cheapness) | ||
| P/E Ratio ⓘ | 11.35 | 12.26 |
| P/B Ratio ⓘ | 1.34 | 1.23 |
| FCF Yield ⓘ | 7.78% | 10.40% |
| Dividend Yield ⓘ | 1.59% | 3.02% |
| EBIT / EV ⓘ | 13.20% | 8.14% |
| PEG ⓘ | N/A | |
Growth (Business expansion) | ||
| Revenue Growth ⓘ | 24.10% | 9.25% |
| RPS Growth (5Y CAGR) ⓘ | 6.64% | 12.19% |
| EPS Growth (5Y CAGR) ⓘ | 4.81% | -9.36% |
| BVPS Growth (5Y CAGR) ⓘ | 5.28% | 4.99% |
| Margin Growth (5Y Trend) ⓘ | -23.85% | -3.86% |
| FCF Growth (5Y CAGR) ⓘ | 31.76% | 4.81% |
| DPS Growth (5Y CAGR) ⓘ | 12.22% | 8.79% |
Quality (Business durability) | ||
| ROIC (Latest) ⓘ | 9.15% | 9.49% |
| ROE (Latest) ⓘ | 12.02% | 13.87% |
| ROA (Latest) ⓘ | 1.40% | 1.54% |
| ROIC (5Y Median) ⓘ | 6.69% | 7.86% |
| ROE (5Y Median) ⓘ | 8.65% | 12.17% |
| ROA (5Y Median) ⓘ | 0.94% | 1.30% |
| Net Debt / EBIT (Latest) ⓘ | 0.91 | 0.99 |
| Net Debt / EBIT (5Y Median) ⓘ | -4.57 | 0.73 |
| Net Debt / EBITDA (Latest) ⓘ | 0.52 | 0.91 |
| Operating Margin (Latest) ⓘ | 23.85% | 22.30% |
| Operating Margin (5Y Median) ⓘ | 20.07% | 24.63% |
| Debt to Equity (Latest) ⓘ | 16.63% | 58.04% |
| Profit Margin (Latest) ⓘ | 34.10% | 26.57% |
| Free Cash Flow (Latest) ⓘ | $198.17M | |
Momentum (Price trend) | ||
| 3Y Return ⓘ | +88.13% | +88.26% |
| 12M Return (excl. last month) ⓘ | +4.79% | +19.24% |
| 6M Return ⓘ | -2.49% | +4.70% |
| Price vs. 200-Day MA ⓘ | -6.85% | +3.66% |
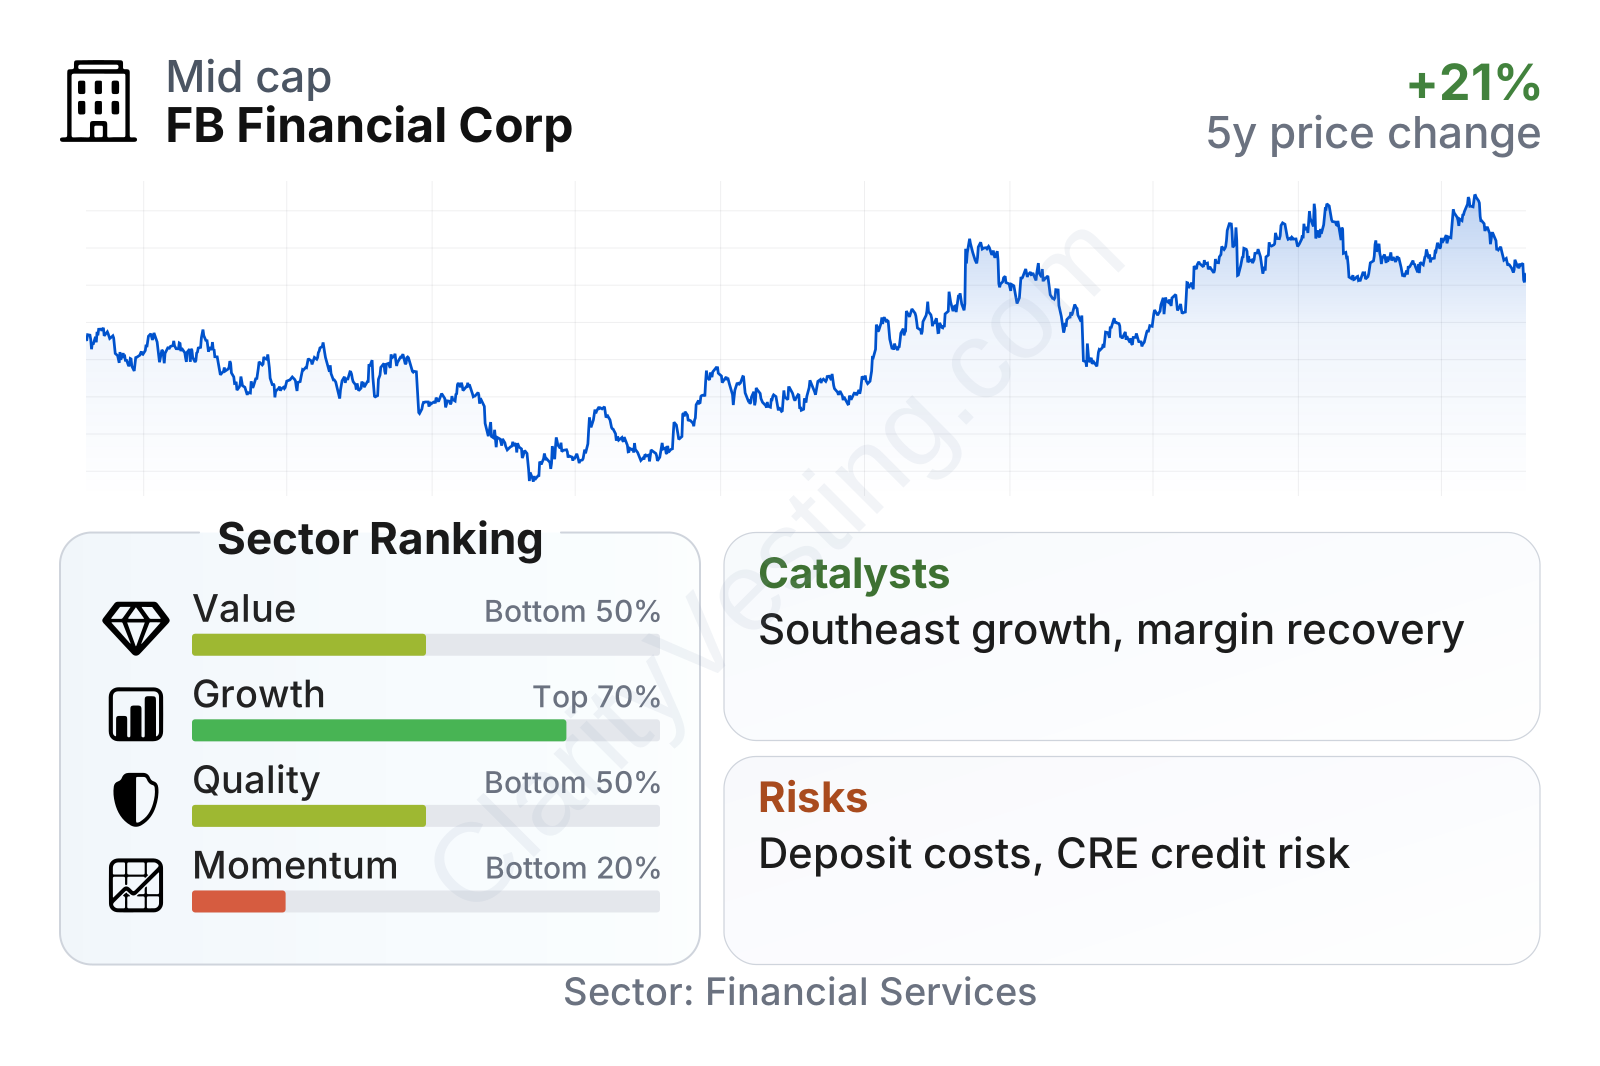
FB Financial is a mid-sized regional bank with a market value in the low billions and a share-price volatility close to the broader market. The factor profile is mixed. Growth metrics look stronger than much of the regional bank group, helped by recent revenue growth and steady expansion in book value per share. Quality metrics are closer to the middle to lower end of the sector, while recent share-price momentum has been weak compared with peers. On valuation, the stock does not screen as unusually cheap on every measure: earnings valuation is slightly below the sector median, but price-to-book sits somewhat above the sector median.
The stock-price history also shows that sentiment has been cyclical. Shares fell sharply during the 2023 regional banking stress period, then recovered strongly through 2024 and into 2026. That pattern is common in banking: market confidence can swing much faster than the underlying branch network or customer base.
Growth
FB Financial operates in a sector that should still have room for long-term expansion, especially in faster-growing Southeastern states. Population growth, business formation, and migration into markets such as Tennessee and nearby states can support demand for commercial loans, real estate lending, treasury services, and household banking products. Regional banks with solid local relationships can benefit when those markets expand faster than the national average.
The company’s strategy appears logical for that backdrop. FB Financial has emphasized community-bank style relationships, commercial banking, and selective expansion in attractive local markets. For a regional bank, this can be a sensible model because it builds lower-cost deposit relationships and opens the door to cross-selling additional services beyond simple lending.
Earnings per share have been uneven but have generally improved after the 2022 decline. That matters because it suggests the company has been able to rebuild profitability despite a tougher interest-rate environment. Five-year EPS growth is positive, and notably stronger than a sector median that has been negative over the same span, even if year-to-year results have not been smooth.
Book value per share has followed a steadier path upward, which is often one of the clearest signs of value creation for a bank over time. FB Financial’s five-year book value per share growth is slightly above the sector median, indicating that capital has continued to build even through a difficult period for the banking industry.
A meaningful catalyst is the possibility of improved profitability if funding pressure eases. Banks have spent the last few years paying more to keep and attract deposits. If deposit costs stabilize or decline while loan yields remain healthy, earnings can improve without requiring exceptional balance-sheet growth. Another catalyst is continued loan and customer growth in the Southeast, where demographic trends remain more favorable than in slower-growing regions.
Recent company updates have also pointed to ongoing loan production, deposit franchise development, and capital strength. None of those alone transforms the business, but together they support the case that FB Financial is trying to grow through disciplined banking rather than depending on one-time gains.
Risks
This article is for informational purposes only and does not constitute financial advice. Some content is AI-generated. See Disclaimer


