Stock Analysis · Diamondback Energy Inc (FANG)
Overview
Diamondback Energy is a large independent oil and gas producer focused mainly on the Permian Basin in West Texas and New Mexico, one of the most productive shale regions in the United States. Its business is straightforward: it acquires acreage, drills wells, produces crude oil, natural gas, and natural gas liquids, and then sells those commodities into the market. Over time, the company has expanded through both drilling and acquisitions, which has made it one of the biggest pure-play Permian operators.
For a long-term reader, the key point is that Diamondback is primarily an upstream energy company. That means its results depend mostly on how much oil and gas it produces, how efficiently it drills, and the prices it receives for those products. It is not mainly a refiner or pipeline owner, so its earnings can move sharply with commodity cycles.
Based on recent company reporting, revenue is overwhelmingly tied to hydrocarbon sales, with crude oil clearly the largest contributor. A simple way to think about the business mix is:
- Oil sales: approximately 70% to 80% of total revenue. This is the core of the business and the main profit driver.
- Natural gas liquids sales: approximately 10% to 20% of total revenue. This includes products such as propane, butane, and related liquids separated during production.
- Natural gas sales: approximately 5% to 15% of total revenue. This is a smaller share than oil but still meaningful, especially when production volumes grow.
- Other operating revenue: usually a small residual amount, including items such as midstream-related or ancillary revenue when disclosed.
The broad financial pattern of the last several years shows a company that has materially expanded its revenue base, but with much more volatility in profit than in sales. Revenue rose strongly from 2021 through 2025, while net income peaked earlier and then compressed as costs, acquisition effects, and commodity-price changes moved through the income statement. That is a good reminder that for producers like Diamondback, sales growth does not always flow smoothly into earnings growth.
The visual breakdown highlights that revenue has climbed sharply over time, but margins have not moved in a straight line. Operating profit remained substantial, yet the gap between revenue and net income widened in the latest period, showing how sensitive the business is to costs, pricing, and non-cash charges after large-scale expansion.
Key Figures
| Metric | Value | Sector ⓘ |
|---|---|---|
| Date | Oct 03, 2026 | |
| Context | ||
| Sector | Energy | |
| Industry | Oil & Gas E&P | |
| Market Cap ⓘ | $51.51B | |
| Beta ⓘ | 0.41 | |
Value (Cheapness) | ||
| P/E Ratio ⓘ | 35.04 | 14.47 |
| P/B Ratio ⓘ | 1.62 | 1.70 |
| FCF Yield ⓘ | 12.61% | 8.66% |
| Dividend Yield ⓘ | 2.29% | 3.77% |
| EBIT / EV ⓘ | 2.91% | 7.46% |
| PEG ⓘ | 22.29 | |
Growth (Business expansion) | ||
| Revenue Growth ⓘ | 52.50% | 27.35% |
| RPS Growth (5Y CAGR) ⓘ | 8.12% | 6.75% |
| EPS Growth (5Y CAGR) ⓘ | -19.40% | -15.45% |
| BVPS Growth (5Y CAGR) ⓘ | 14.83% | 5.85% |
| Margin Growth (5Y Trend) ⓘ | -31.79% | 0.75% |
| FCF Growth (5Y CAGR) ⓘ | 33.56% | 3.62% |
| DPS Growth (5Y CAGR) ⓘ | 22.79% | 16.85% |
Quality (Business durability) | ||
| ROIC (Latest) ⓘ | 2.84% | 11.33% |
| ROA (Latest) ⓘ | 2.17% | 6.03% |
| ROIC (5Y Median) ⓘ | 14.52% | 10.16% |
| ROA (5Y Median) ⓘ | 10.77% | 5.34% |
| Net Debt / EBIT (Latest) ⓘ | 6.50 | 1.62 |
| Net Debt / EBIT (5Y Median) ⓘ | 1.98 | 1.91 |
| Net Debt / EBITDA (Latest) ⓘ | 1.71 | 1.06 |
| Net Debt / Assets ⓘ | 17.31% | 17.29% |
| EBITDA / Interest ⓘ | 26.69 | 9.64 |
| Operating Margin (Latest) ⓘ | 10.93% | 16.32% |
| Operating Margin (5Y Median) ⓘ | 45.89% | 19.53% |
| Debt to Equity (Latest) ⓘ | 33.28% | 54.41% |
| Profit Margin (Latest) ⓘ | 9.03% | 8.79% |
| Free Cash Flow (Latest) ⓘ | $6.50B | |
Momentum (Price trend) | ||
| 3Y Return ⓘ | +32.47% | +62.93% |
| 12M Return (excl. last month) ⓘ | +38.01% | +44.83% |
| 6M Return ⓘ | -6.04% | -1.62% |
| Price vs. 200-Day MA ⓘ | +0.58% | +5.18% |
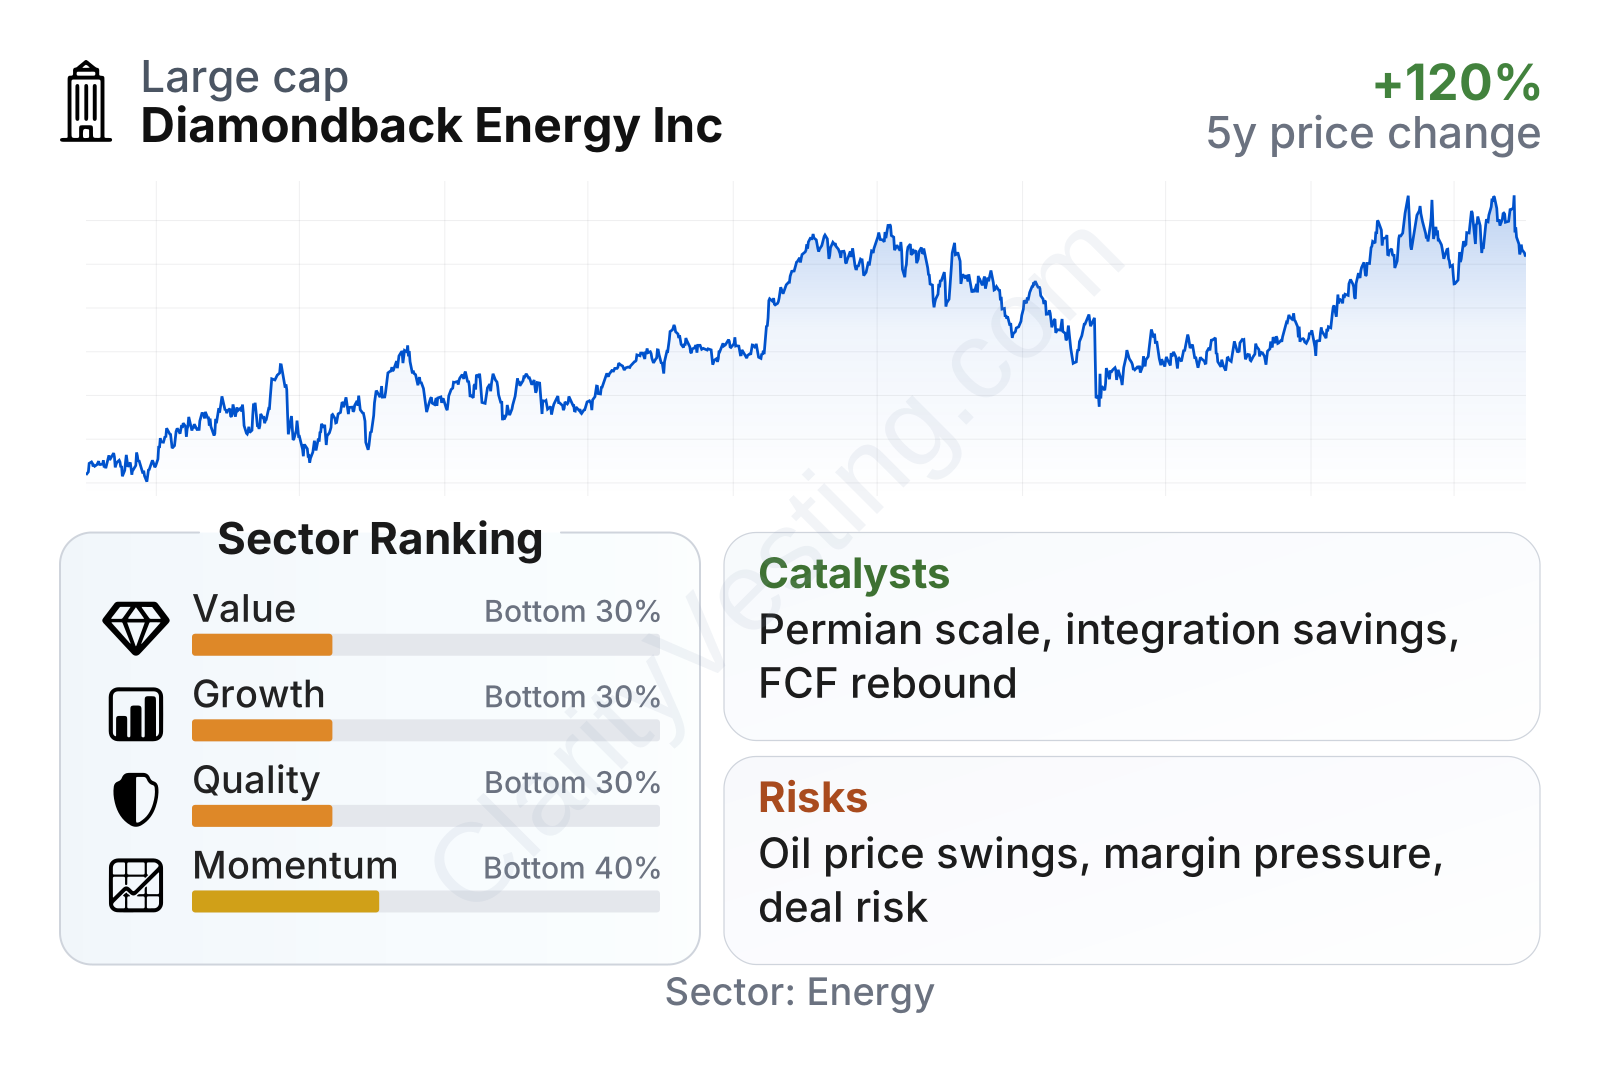
Diamondback is a large-cap energy company with relatively low share-price volatility for the sector, reflected in a beta well below 1. On valuation, the picture is mixed. The stock screens weakly on earnings-based measures compared with the sector, but free cash flow yield remains stronger than the industry median. Quality metrics also look uneven: leverage is moderate on a debt-to-equity basis, interest coverage is strong, but recent returns on capital are below many sector peers. Growth indicators are similarly split, with strong revenue and free cash flow expansion over multiyear periods, but weaker recent earnings trend and margin direction. In short, the market appears to be giving more weight to current profitability pressure than to the company’s scale and cash-generation potential.
Growth
Diamondback operates in a sector that is mature rather than structurally high-growth, but that does not mean growth is absent. In oil and gas exploration and production, growth usually comes from consolidation, drilling inventory, operating efficiency, and disciplined capital allocation rather than from a constantly expanding end market. The Permian Basin remains one of the few global regions where large producers can still add volumes with comparatively attractive economics, so location matters a lot here.
The company’s strategy has generally been consistent with that logic. Diamondback has focused on building scale in the Permian, lowering unit costs, and increasing inventory depth through acquisitions. In practical terms, that can matter more than headline production growth alone. A larger, more contiguous acreage position can improve drilling efficiency, reduce infrastructure duplication, and allow the company to optimize where and when it develops wells.
Recent revenue growth has been volatile, which is normal in this industry, but the latest reading shows a clear reacceleration. That rebound suggests the company is still capable of posting strong top-line expansion when production additions and commodity conditions line up. Over a five-year span, revenue per share growth has also remained ahead of the sector median, which points to real business expansion rather than purely financial engineering.
Free cash flow has been less smooth than the revenue line. There was a sharp setback during the recent expansion phase, followed by a return to positive territory. For long-term analysis, that pattern is important: Diamondback has shown it can generate large cash surpluses, but those surpluses can be interrupted by acquisitions, heavier development spending, or weaker pricing. Even so, trailing free cash flow remains large in absolute terms, giving the company meaningful financial flexibility.
One of the clearest catalysts is scale. The company’s enlarged Permian footprint increases the number of drilling locations it can develop and strengthens its position with service providers, infrastructure partners, and marketing channels. Another catalyst is efficiency: if management continues to improve well productivity and capital discipline, the business can still grow cash generation even without a major rise in oil prices.
Recent company updates have also pointed to ongoing integration and portfolio high-grading after major transactions. That can create opportunity if management successfully captures cost savings, streamlines operations, and prioritizes the best-return acreage. In a commodity business, operational execution often matters as much as the commodity itself, and that is one of the areas where Diamondback’s future growth case rests.
Risks
This article is for informational purposes only and does not constitute financial advice. Some content is AI-generated. See Disclaimer


