Stock Analysis · Exelixis Inc (EXEL)
Overview
Exelixis is a biotechnology company focused on cancer medicines. Its business is built around discovering, developing, and commercializing targeted therapies, with its best-known product being CABOMETYX (cabozantinib), a treatment used in several types of advanced cancer. The company also markets COMETRIQ, an older cabozantinib product for a narrower indication, and it is investing heavily in expanding cabozantinib into new uses while also building a next wave of oncology programs.
For long-term analysis, the most important point is that Exelixis is not an early-stage biotech living mainly on hope. It is already a profitable commercial company with meaningful cash generation, but its revenue base remains concentrated around one main medicine and related partnerships. That creates a mix of strength and dependency at the same time.
Revenue comes primarily from product sales and collaboration-related income. Based on recent annual results, the business mix is approximately:
- Net product revenues: about 75% to 80% — mainly U.S. sales of CABOMETYX, plus a much smaller contribution from COMETRIQ.
- Collaboration revenues: about 20% to 25% — license revenue, development-related payments, and profit-sharing or royalty-like economics tied to partners, especially outside the U.S. and in partnered indications.
- Other revenues: minimal — not a meaningful driver of the business.
Within product revenue, CABOMETYX is by far the dominant source. COMETRIQ contributes only a small share. This means Exelixis is commercially established, but its financial profile still depends heavily on one franchise.
The cost structure has improved in a notable way over the last several years. Revenue has risen steadily, while research and development spending, after climbing sharply, became more controlled in the most recent annual period. At the same time, selling and administrative costs have stayed comparatively moderate relative to revenue, helping profit growth accelerate.
The business has become more efficient: sales have grown from roughly $1.4 billion in 2021 to more than $2.3 billion in 2025, while net income expanded much faster. That gap suggests operating leverage, meaning a larger share of each additional revenue dollar is now reaching the bottom line.
Key Figures
| Metric | Value | Sector ⓘ |
|---|---|---|
| Date | Oct 24, 2026 | |
| Context | ||
| Sector | Healthcare | |
| Industry | Biotechnology | |
| Market Cap ⓘ | $16.00B | |
| Beta ⓘ | 0.47 | |
Value (Cheapness) | ||
| P/E Ratio ⓘ | 20.37 | 25.42 |
| P/B Ratio ⓘ | 9.20 | 3.08 |
| FCF Yield ⓘ | 7.24% | 3.12% |
| Dividend Yield ⓘ | N/A | 1.85% |
| EBIT / EV ⓘ | 7.61% | 0.56% |
| PEG ⓘ | 2.27 | |
Growth (Business expansion) | ||
| Revenue Growth ⓘ | 10.60% | 7.50% |
| RPS Growth (5Y CAGR) ⓘ | 16.61% | 8.60% |
| EPS Growth (5Y CAGR) ⓘ | 21.28% | -17.73% |
| BVPS Growth (5Y CAGR) ⓘ | 2.83% | 3.72% |
| Margin Growth (5Y Trend) ⓘ | 18.50% | -0.57% |
| FCF Growth (5Y CAGR) ⓘ | 25.85% | 0.96% |
| DPS Growth (5Y CAGR) ⓘ | N/A | 6.69% |
Quality (Business durability) | ||
| ROIC (Latest) ⓘ | 41.69% | 3.17% |
| ROA (Latest) ⓘ | 32.37% | 2.98% |
| ROIC (5Y Median) ⓘ | 10.71% | 4.56% |
| ROA (5Y Median) ⓘ | 9.72% | 1.87% |
| Net Debt / EBIT (Latest) ⓘ | -0.11 | 1.34 |
| Net Debt / EBIT (5Y Median) ⓘ | -0.35 | 1.86 |
| Net Debt / EBITDA (Latest) ⓘ | -0.11 | 1.00 |
| Net Debt / Assets ⓘ | -4.63% | 5.06% |
| EBITDA / Interest ⓘ | N/A | 9.55 |
| Operating Margin (Latest) ⓘ | 41.82% | 9.25% |
| Operating Margin (5Y Median) ⓘ | 19.98% | 7.33% |
| Debt to Equity (Latest) ⓘ | 9.00% | 26.68% |
| Profit Margin (Latest) ⓘ | 35.33% | 3.34% |
| Free Cash Flow (Latest) ⓘ | $1.16B | |
Momentum (Price trend) | ||
| 3Y Return ⓘ | +239.27% | +51.61% |
| 12M Return (excl. last month) ⓘ | +46.92% | +19.90% |
| 6M Return ⓘ | +39.40% | +10.10% |
| Price vs. 200-Day MA ⓘ | +29.93% | +6.44% |
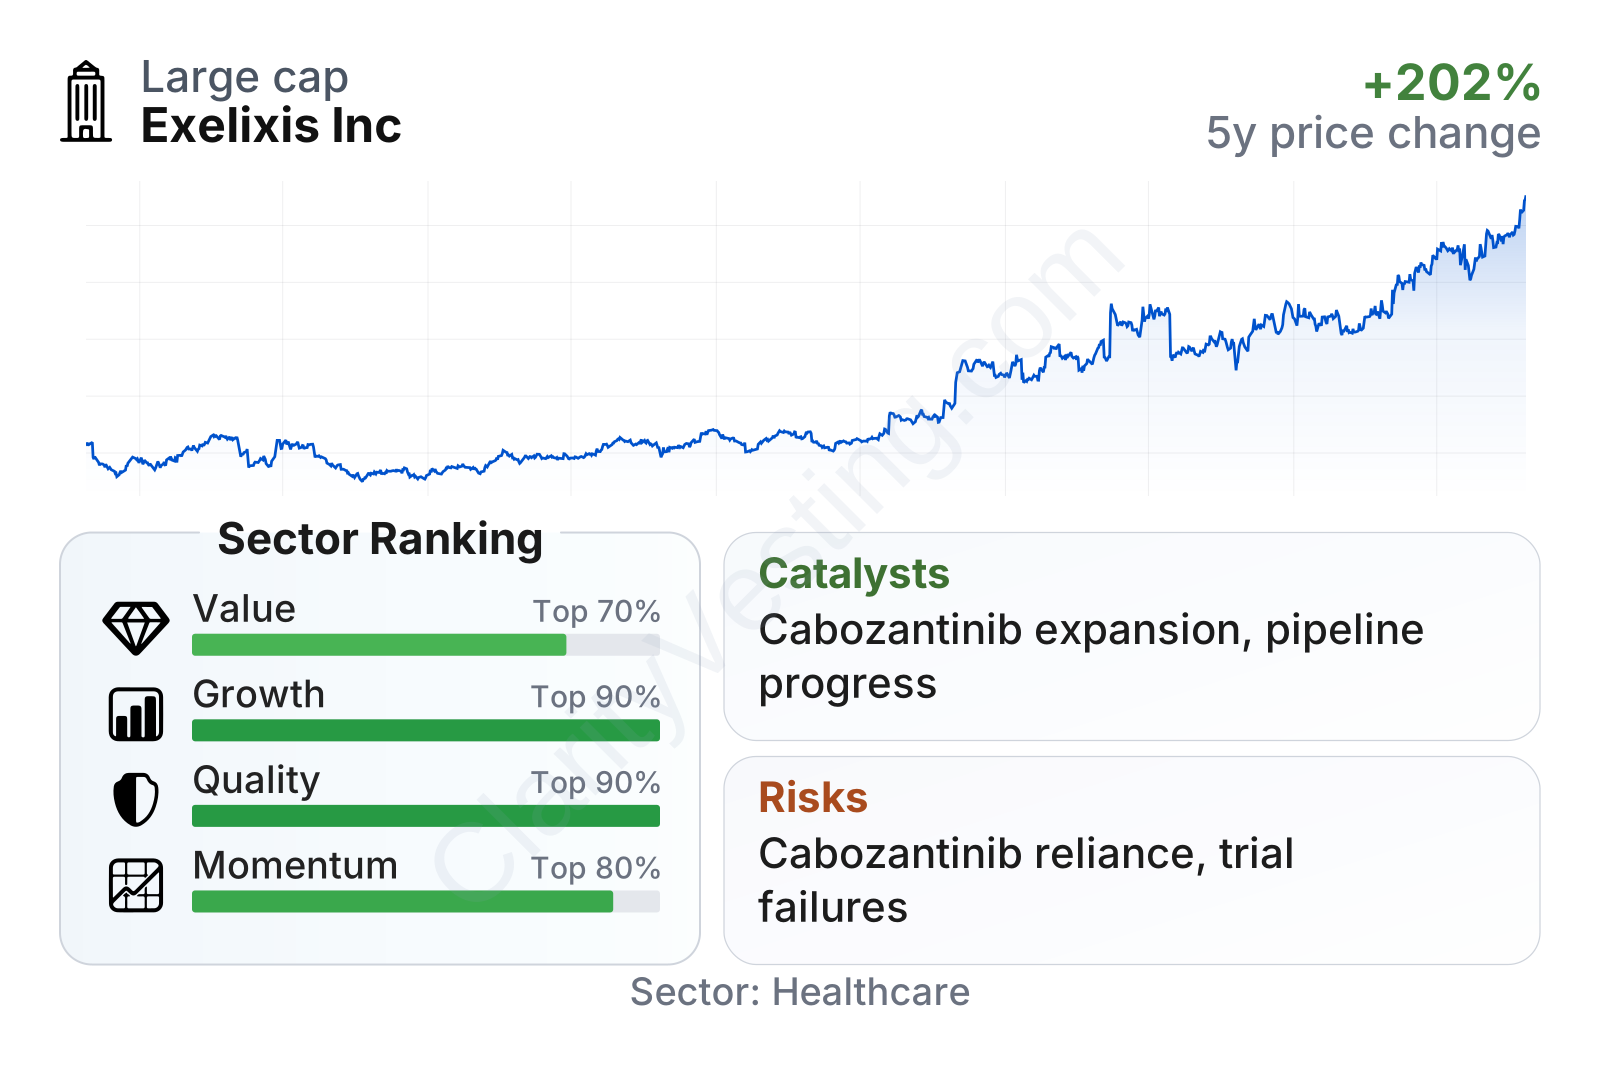
Exelixis stands out in healthcare because it combines characteristics that do not always appear together in biotech: strong growth, strong profitability, and a very conservative balance sheet. Relative to its sector, its quality and growth profile rank near the top, supported by high returns on capital, wide operating margins, and cash generation that is well above many biotech peers.
The stock has also shown strong multi-year price performance, although with the normal volatility seen in drug-development companies. Its beta is low for a biotech name, which suggests its trading pattern has been less erratic than many peers, likely because the company is already profitable and not dependent on repeated financing rounds.
Growth
Exelixis operates in oncology, one of the largest and most durable areas in pharmaceuticals. Cancer treatment remains a growing market because of aging populations, broader diagnosis, longer treatment duration, and continued demand for targeted and combination therapies. That gives the company exposure to a sector with long-term structural tailwinds.
The current strategy is logical. Exelixis is using cash from its established franchise to do two things at once: defend and expand CABOMETYX, and fund a broader pipeline that could eventually reduce dependence on one product. For a long-term view, that is a healthier model than relying only on a single mature asset or only on high-risk early research.
Revenue growth has not been perfectly smooth quarter to quarter, which is normal in biotech due to timing of collaboration payments and treatment dynamics. Even so, the broader pattern remains positive, with recent year-over-year growth still ahead of the sector median. The longer-term picture is stronger than the quarterly noise suggests.
Cash generation has strengthened materially. Free cash flow moved from a much lower base a few years ago to around the $1 billion range on a trailing basis, giving Exelixis unusual flexibility for a biotech company. That cash can support internal research, licensing deals, acquisitions, and shareholder returns without forcing the company into a highly leveraged position.
Several catalysts matter for future expansion. The first is additional development progress for cabozantinib in new combinations or tumor types. The second is pipeline execution beyond cabozantinib, particularly newer oncology candidates that could become the company’s next commercial engines. The third is business development: Exelixis has the balance sheet to add external assets if management sees attractive opportunities.
Recent company updates have continued to emphasize pipeline advancement, clinical data generation, and the use of its cash-rich position to strengthen future growth options. For long-term analysis, that is important because the central question for Exelixis is no longer whether it can generate earnings today, but whether it can transform today’s success into a broader oncology platform.
Risks
This article is for informational purposes only and does not constitute financial advice. Some content is AI-generated. See Disclaimer


