Stock Analysis · Exelon Corporation (EXC)
Overview
Exelon Corporation is one of the largest regulated electric and gas utility groups in the United States. After separating its power generation business in prior years, Exelon is now focused almost entirely on energy delivery rather than electricity production. Its utilities operate transmission and distribution networks that move electricity and, in some territories, natural gas to homes, businesses, and public institutions. That makes Exelon a relatively straightforward utility business: it earns money mainly by investing in and operating essential infrastructure under state-regulated rate frameworks.
Exelon serves customers through six major regulated utilities: Commonwealth Edison in Illinois, PECO in Pennsylvania, BGE in Maryland, Pepco in the District of Columbia and Maryland, Delmarva Power in Delaware and Maryland, and Atlantic City Electric in New Jersey. This footprint gives the company exposure to several densely populated service areas with large capital needs tied to grid modernization, reliability, electrification, and resilience.
Because Exelon is a fully regulated utility company, its revenue mix is better understood by business line than by product brand. Based on company reporting, the main sources of revenue are:
- Electric distribution and transmission revenue: approximately 75% to 85% of total revenue. This includes delivering electricity across local and regional networks, grid access charges, and regulated recovery of infrastructure investments.
- Natural gas distribution revenue: approximately 15% to 25% of total revenue. This comes primarily from gas delivery operations at utilities such as BGE and PECO, including residential, commercial, and industrial service.
- Other utility-related revenue: usually a low single-digit share. This can include service programs, alternative revenue mechanisms, and various regulatory adjustments rather than a large independent operating segment.
One useful point for long-term readers is that reported revenue in utilities can move with customer usage, weather, and the pass-through cost of purchased energy. That means revenue growth does not always translate directly into economic value in the same way it might for a software or consumer brand company. For Exelon, the more important driver is the size of its regulated asset base and the allowed returns approved by regulators.
Over the last several years, the business has expanded its top line and operating income, while interest expense has also moved higher as debt levels and borrowing costs increased. Net income has remained positive and generally trended upward, reflecting the stability that regulated utility structures can provide even when cost inflation is present.
Key Figures
| Metric | Value | Sector ⓘ |
|---|---|---|
| Date | Oct 17, 2026 | |
| Context | ||
| Sector | Utilities | |
| Industry | Utilities - Regulated Electric | |
| Market Cap ⓘ | $43.28B | |
| Beta ⓘ | 0.40 | |
Value (Cheapness) | ||
| P/E Ratio ⓘ | 15.44 | 17.28 |
| P/B Ratio ⓘ | 1.47 | 1.51 |
| FCF Yield ⓘ | -4.43% | 0.65% |
| Dividend Yield ⓘ | 3.87% | 3.77% |
| EBIT / EV ⓘ | 5.71% | 5.01% |
| PEG ⓘ | 2.25 | |
Growth (Business expansion) | ||
| Revenue Growth ⓘ | 9.90% | 6.10% |
| RPS Growth (5Y CAGR) ⓘ | 6.97% | 3.87% |
| EPS Growth (5Y CAGR) ⓘ | -13.02% | -11.30% |
| BVPS Growth (5Y CAGR) ⓘ | -5.11% | 4.23% |
| Margin Growth (5Y Trend) ⓘ | 5.93% | 3.57% |
| FCF Growth (5Y CAGR) ⓘ | -17.74% | -8.84% |
| DPS Growth (5Y CAGR) ⓘ | 1.13% | 4.84% |
Quality (Business durability) | ||
| ROIC (Latest) ⓘ | 5.47% | 6.53% |
| ROA (Latest) ⓘ | 2.38% | 3.20% |
| ROIC (5Y Median) ⓘ | 5.67% | 5.95% |
| ROA (5Y Median) ⓘ | 2.35% | 2.75% |
| Net Debt / EBIT (Latest) ⓘ | 9.63 | 7.13 |
| Net Debt / EBIT (5Y Median) ⓘ | 10.11 | 7.23 |
| Net Debt / EBITDA (Latest) ⓘ | 5.63 | 4.31 |
| Net Debt / Assets ⓘ | 42.35% | 38.42% |
| EBITDA / Interest ⓘ | 4.10 | 4.58 |
| Operating Margin (Latest) ⓘ | 20.93% | 20.83% |
| Operating Margin (5Y Median) ⓘ | 20.18% | 20.08% |
| Debt to Equity (Latest) ⓘ | 176.05% | 137.69% |
| Profit Margin (Latest) ⓘ | 10.99% | 11.37% |
| Free Cash Flow (Latest) ⓘ | -$1.92B | |
Momentum (Price trend) | ||
| 3Y Return ⓘ | +19.42% | +52.37% |
| 12M Return (excl. last month) ⓘ | +2.09% | +8.84% |
| 6M Return ⓘ | -10.79% | -3.95% |
| Price vs. 200-Day MA ⓘ | -5.08% | -0.79% |
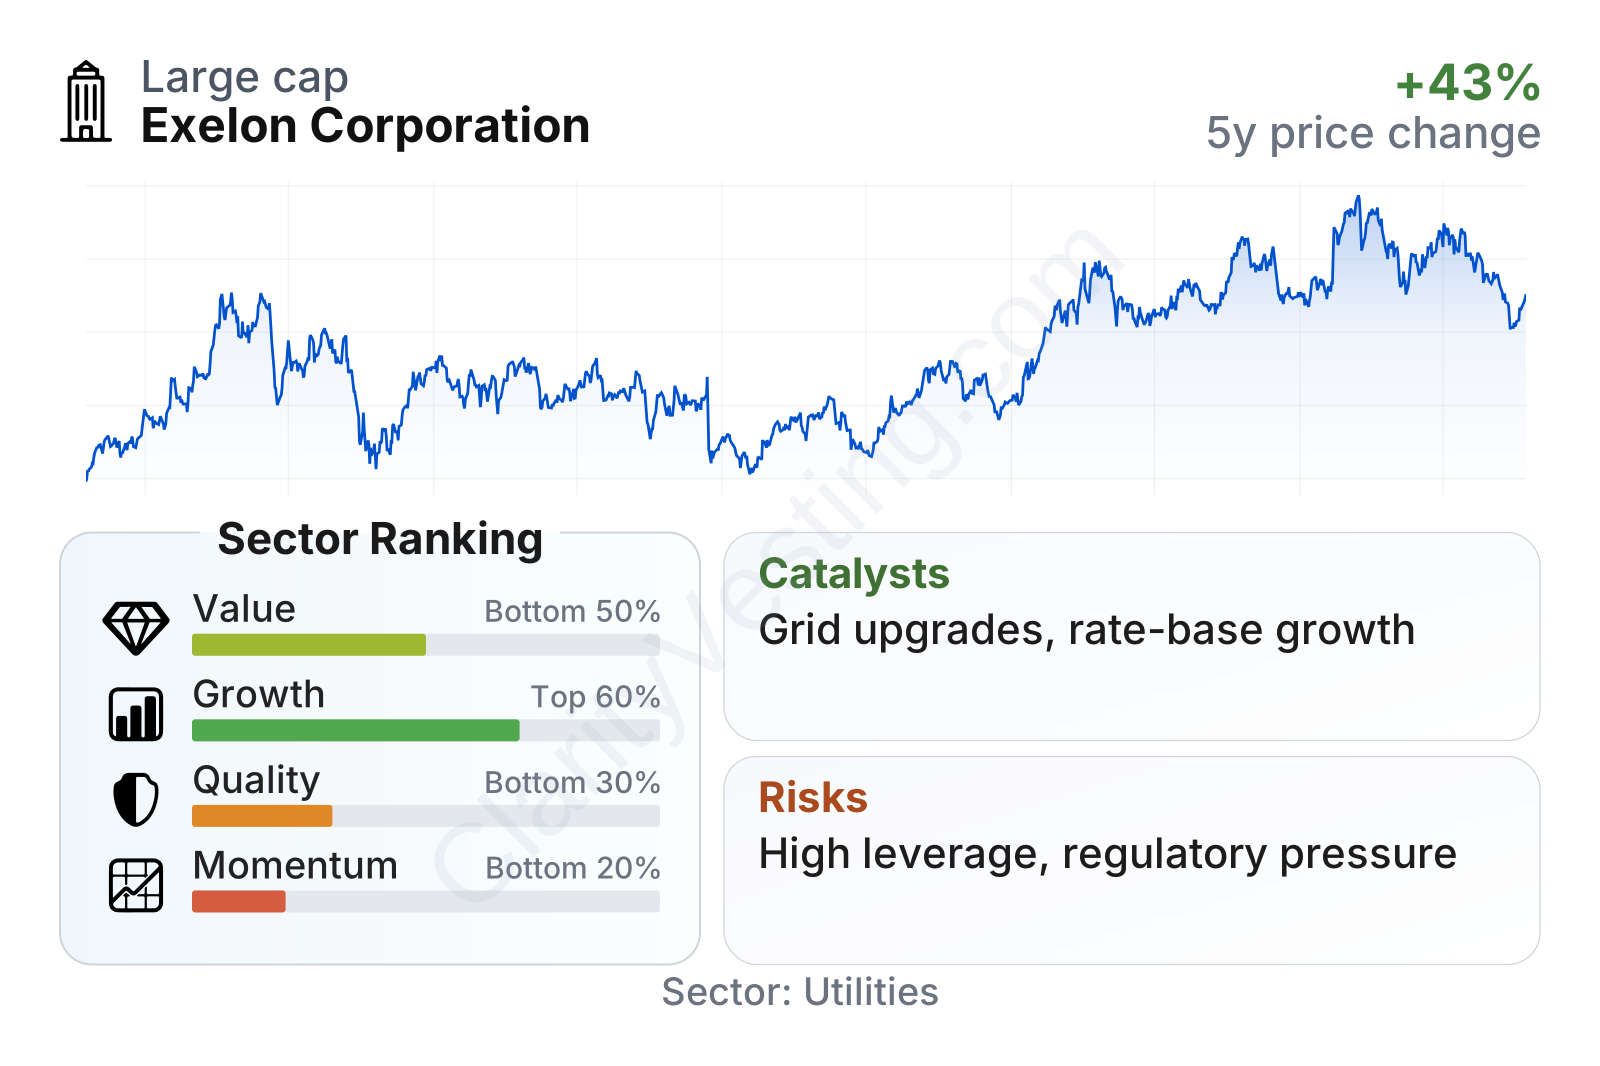
Exelon is a large-cap utility with a very low beta of about 0.39, which fits the defensive nature of regulated electricity and gas delivery. In the factor breakdown, growth looks better than quality and momentum. Revenue expansion has been stronger than the sector median over both the last year and the last five years on a per-share basis, but returns on capital and balance-sheet leverage are weaker than many peers. The stock’s recent market performance has also lagged the broader regulated utility group, even though the valuation multiples remain slightly below sector medians on earnings and book value.
The price history shows a stock that has generally moved within a utility-like range rather than behaving like a high-volatility cyclical company. The longer trend has been positive, but recent weakness relative to the sector suggests the market remains cautious about leverage, free cash flow pressure, and the pace at which future rate-base growth will convert into shareholder returns.
Growth
Exelon operates in a sector with durable long-term demand. Electric grids across the United States need major investment to support reliability, storm hardening, renewable interconnection, data center demand, transportation electrification, and broader electricity use growth. That backdrop is favorable for transmission and distribution utilities because regulators often allow recovery of approved infrastructure spending over time.
For Exelon specifically, the strategy makes sense: deploy capital into regulated networks in large metropolitan territories where the need for modernization is ongoing and difficult to avoid. That tends to create visible earnings pathways compared with more cyclical industries. The business does not need explosive demand growth to expand; it mainly needs constructive regulation and consistent execution on capital projects.
Revenue per share has increased steadily over the last five years, rising from the high teens to nearly $24. That is a healthy signal for a regulated utility, especially since it suggests growth has not relied only on issuing large amounts of new equity. It also supports the view that Exelon’s service territories continue to offer meaningful room for investment-led expansion.
A major catalyst is the industrywide push to strengthen and digitize electric grids. Exelon’s utilities serve regions where aging infrastructure, extreme weather resilience, and electrification are all important policy priorities. If regulators continue approving large multiyear capital programs, Exelon can expand its rate base and earnings capacity with relatively high visibility.
Another growth angle is load demand from commercial and institutional customers, including the broader impact of AI-related data center expansion and electrification of heating and transport. Exelon is not a power producer, so it benefits indirectly through the need for more robust delivery networks rather than through commodity exposure.
Free cash flow remains a constraint in the near term. It has stayed negative for multiple years, which is common for utilities in heavy investment cycles, but it still matters because growth funded mainly through debt and external capital is less flexible than growth supported internally. In Exelon’s case, the negative cash flow pattern looks more like an infrastructure buildout profile than an operational breakdown, yet it increases dependence on financing conditions.
Recent company updates have continued to emphasize capital investment, grid reliability, customer affordability programs, and execution within state-regulated plans. For a utility like Exelon, those are the practical building blocks of future growth rather than splashy product launches.
Risks
This article is for informational purposes only and does not constitute financial advice. Some content is AI-generated. See Disclaimer


