Stock Analysis · Evergy Inc (EVRG)
Overview
Evergy is a regulated electric utility serving customers mainly in Kansas and Missouri. In simple terms, it owns and operates power plants, transmission lines, and local distribution networks that deliver electricity to homes, businesses, public institutions, and industrial customers. Because it operates in regulated service territories, its prices and returns are overseen by state utility regulators rather than set freely by the market.
This business model makes Evergy different from most companies. Demand for electricity is usually steadier than demand in many other industries, and revenue is tied largely to the size of its customer base, allowed rate increases, weather patterns, and the amount of capital it invests in the grid and generation system.
Based on Evergy’s recent annual reporting, revenue is overwhelmingly tied to electricity sales and related regulated utility activities. The main sources can be summarized as follows:
- Residential retail electric service: approximately 36% to 40% of revenue. This includes electricity delivered to households across its service areas.
- Commercial retail electric service: approximately 28% to 32%. This covers offices, stores, schools, hospitals, and other non-industrial business users.
- Industrial retail electric service: approximately 12% to 16%. This comes from larger energy-consuming manufacturing and industrial customers.
- Wholesale and other electric revenue: approximately 12% to 18%. This includes power sold to other utilities, municipalities, cooperatives, and other miscellaneous regulated electric activities.
- Transmission and other regulated mechanisms: the remaining share, generally in the single-digit to low-teens range depending on classification and period. This can include recovery mechanisms, rider revenues, and other utility-related items.
In practice, Evergy is not a diversified conglomerate. It is primarily a regional electricity provider, and that concentration makes the company easier to understand: long-term performance depends mostly on regulation, infrastructure investment, customer demand growth, and financing costs.
Over the last several years, revenue has been fairly stable, while operating income has improved more than sales. That points to a business that is not expanding rapidly, but has shown some ability to protect profitability. The pressure point is interest expense, which has climbed materially as debt costs and borrowing needs have risen.
Key Figures
| Metric | Value | Sector ⓘ |
|---|---|---|
| Date | Oct 03, 2026 | |
| Context | ||
| Sector | Utilities | |
| Industry | Utilities - Regulated Electric | |
| Market Cap ⓘ | $18.15B | |
| Beta ⓘ | 0.51 | |
Value (Cheapness) | ||
| P/E Ratio ⓘ | 20.03 | 16.80 |
| P/B Ratio ⓘ | 1.82 | 1.48 |
| FCF Yield ⓘ | -7.74% | 0.64% |
| Dividend Yield ⓘ | 3.53% | 3.91% |
| EBIT / EV ⓘ | 5.00% | 5.01% |
| PEG ⓘ | 3.04 | |
Growth (Business expansion) | ||
| Revenue Growth ⓘ | 4.40% | 6.00% |
| RPS Growth (5Y CAGR) ⓘ | 1.02% | 4.14% |
| EPS Growth (5Y CAGR) ⓘ | -20.73% | -11.39% |
| BVPS Growth (5Y CAGR) ⓘ | 1.98% | 4.29% |
| Margin Growth (5Y Trend) ⓘ | 0.99% | 3.55% |
| FCF Growth (5Y CAGR) ⓘ | N/A | -9.10% |
| DPS Growth (5Y CAGR) ⓘ | 4.89% | 4.51% |
Quality (Business durability) | ||
| ROIC (Latest) ⓘ | 6.20% | 6.53% |
| ROA (Latest) ⓘ | 2.69% | 3.19% |
| ROIC (5Y Median) ⓘ | 5.92% | 6.12% |
| ROA (5Y Median) ⓘ | 2.60% | 2.76% |
| Net Debt / EBIT (Latest) ⓘ | 10.20 | 7.15 |
| Net Debt / EBIT (5Y Median) ⓘ | 9.93 | 7.24 |
| Net Debt / EBITDA (Latest) ⓘ | 5.84 | 4.40 |
| Net Debt / Assets ⓘ | 46.60% | 39.16% |
| EBITDA / Interest ⓘ | 4.33 | 4.41 |
| Operating Margin (Latest) ⓘ | 26.61% | 20.93% |
| Operating Margin (5Y Median) ⓘ | 24.59% | 20.18% |
| Debt to Equity (Latest) ⓘ | 161.38% | 140.88% |
| Profit Margin (Latest) ⓘ | 15.19% | 11.32% |
| Free Cash Flow (Latest) ⓘ | -$1.41B | |
Momentum (Price trend) | ||
| 3Y Return ⓘ | +74.85% | +48.75% |
| 12M Return (excl. last month) ⓘ | +17.66% | +11.24% |
| 6M Return ⓘ | -2.64% | -3.69% |
| Price vs. 200-Day MA ⓘ | -1.86% | -1.97% |
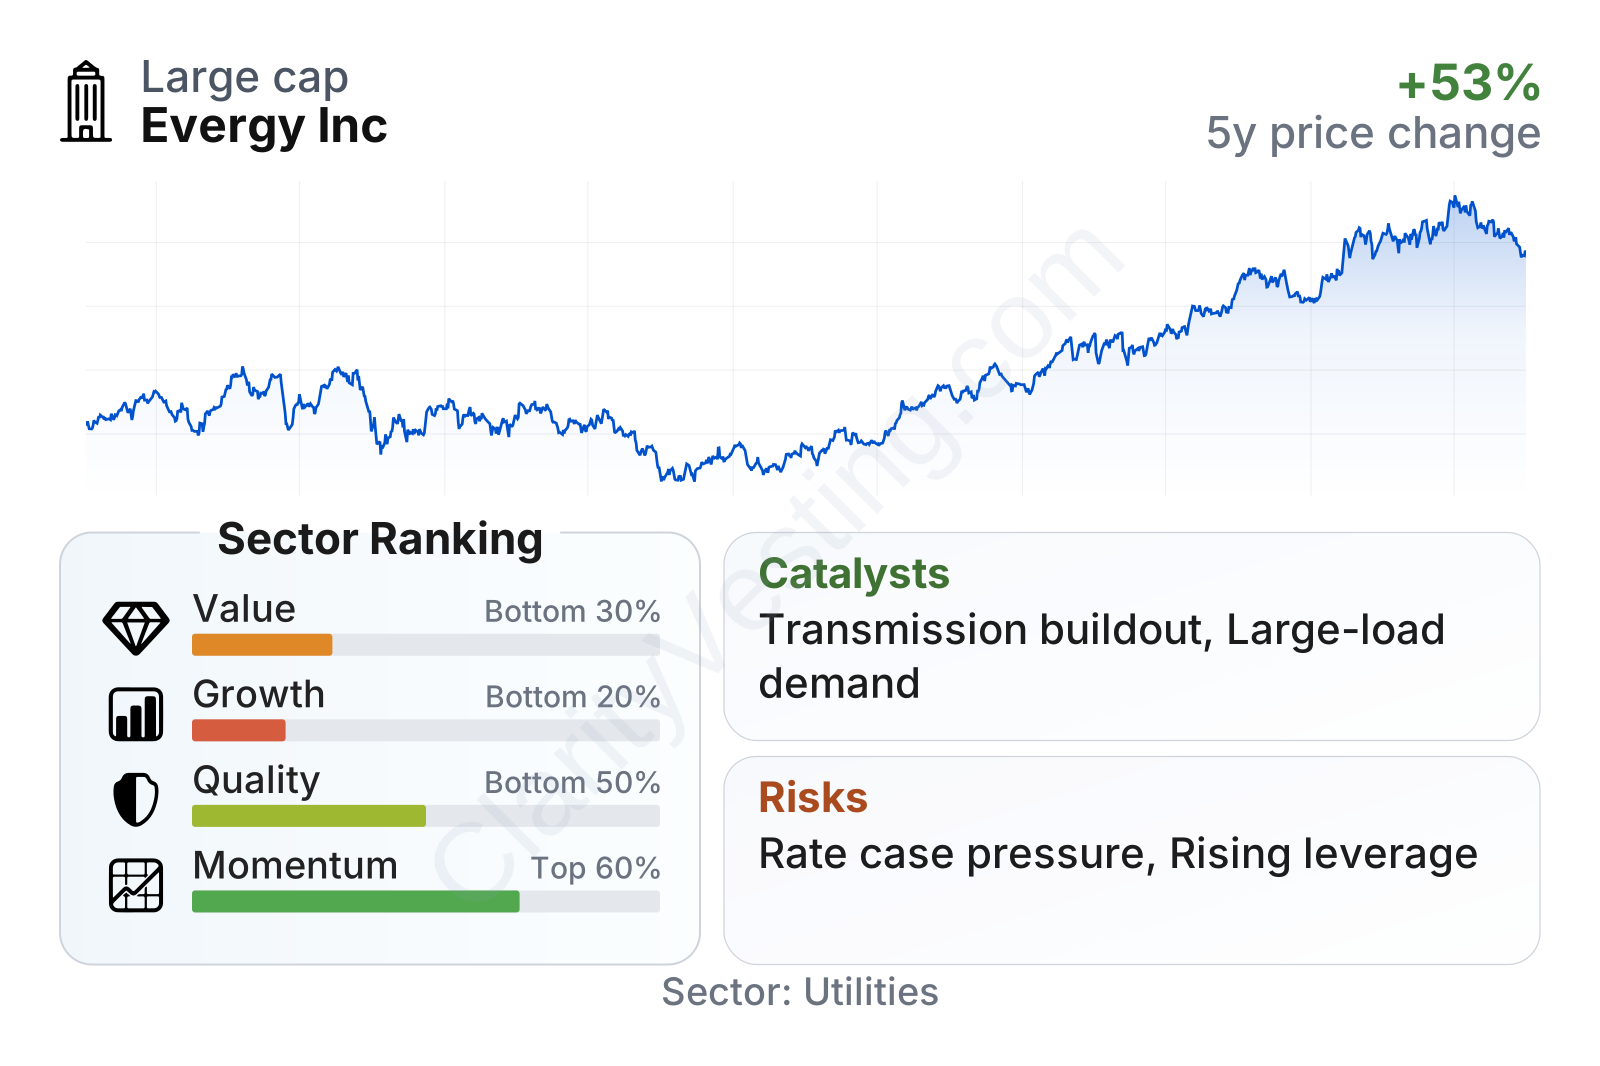
Evergy stands out as a large, lower-volatility utility, with a beta near 0.5. The overall profile is mixed: profitability is better than many regulated peers, but growth and balance-sheet flexibility rank weaker. Valuation also looks less favorable than the sector median, with a higher earnings multiple, a higher price-to-book ratio, and negative free cash flow weighing on the value picture.
The stock’s longer-term price trend has been strong, especially over the last three years, which helps explain why the dividend yield has moved lower. This has been more a re-rating of the shares than a sign of fast underlying business expansion.
Growth
Evergy operates in a sector that is structurally important and gradually growing. Electricity demand in the United States is being supported by data centers, industrial reshoring, grid modernization, electrification, and the need for more transmission capacity. That does not turn a regulated utility into a high-growth company, but it does create a favorable backdrop for utilities that can put capital to work and earn approved returns on that investment.
For Evergy, the central growth logic is straightforward: invest in generation, transmission, and distribution assets; seek regulatory approval to recover those investments; and expand earnings steadily over time. This strategy is standard for the sector, but it still matters whether a company has enough opportunities in its territory. Evergy’s region has been attracting attention for economic development and large-load demand, which can support future capital spending and a larger regulated asset base.
Revenue per share has been mostly flat over the last five years, with only modest progress overall. That confirms that Evergy’s growth profile remains measured rather than dynamic. The more attractive angle is not top-line acceleration, but the possibility of incremental earnings growth from approved infrastructure spending and customer additions in selected parts of its footprint.
Free cash flow has remained negative and has become more deeply negative recently, which is common when utilities are in heavy investment cycles. For Evergy, that suggests the company is spending aggressively on its system. The opportunity is that these investments can support future regulated returns. The trade-off is that cash generation lags in the short term and financing needs rise.
Recent company updates have emphasized transmission development, reliability spending, and economic development opportunities in its service territory. Those themes matter because they can create a multi-year pipeline of projects. If electricity demand from large commercial or industrial customers keeps building in Kansas and Missouri, Evergy could have a clearer runway for regulated asset growth than a mature utility with flat local demand.
Risks
This article is for informational purposes only and does not constitute financial advice. Some content is AI-generated. See Disclaimer


