Stock Analysis · Entergy Corporation (ETR)
Overview
Entergy Corporation is a regulated electric utility serving customers mainly in Arkansas, Louisiana, Mississippi, and Texas, with New Orleans also included through a separate regulated utility. In simple terms, the company produces, buys, transmits, and delivers electricity, then earns most of its money through rates approved by state and federal regulators. That makes Entergy different from many ordinary businesses: demand is relatively steady, but growth and profitability depend heavily on allowed returns, grid investment, and regulatory decisions.
The business is now centered primarily on regulated utility operations after the separation of its former merchant nuclear business. That means Entergy is more straightforward for long-term analysis than it used to be: it is largely a rate-base growth utility, investing in power plants, poles, wires, substations, and resilience upgrades, then seeking recovery of those costs through customer bills over time.
Based on recent company disclosures, Entergy’s revenue sources are concentrated in regulated electric operations, with customer classes and operating utilities driving the mix rather than a wide range of unrelated businesses.
- Residential electricity sales: approximately 35% to 40% of utility revenue. This includes households using power for air conditioning, heating, lighting, and appliances across Entergy’s service territory.
- Commercial electricity sales: approximately 25% to 30%. This covers offices, retail, healthcare facilities, schools, and other service-sector users.
- Industrial electricity sales: approximately 20% to 25%. This is an important category for Entergy because the Gulf South region includes refineries, chemicals, manufacturing, and other power-intensive operations.
- Other retail and public authority sales: approximately 5% to 10%. This generally includes municipalities, public agencies, and smaller customer categories.
- Transmission and other utility-related revenue: approximately 5% to 10%. This includes federally regulated transmission revenue and other items tied to operating the electric system.
Another useful way to see Entergy is by geography and regulation: nearly all of its earnings power comes from monopoly utility service territories where customers generally do not choose another local power provider. That creates stability, although it also means expansion is usually tied to capital spending and customer growth within its existing footprint rather than rapid national market share gains.
The overall picture shows a business with fairly stable revenue over the last several years, but with swings in net income caused by taxes, fuel and purchased power costs, storm effects, and financing costs. Operating income has held up better than headline earnings, which is often more informative for a regulated utility.
Key Figures
| Metric | Value | Sector ⓘ |
|---|---|---|
| Date | Oct 17, 2026 | |
| Context | ||
| Sector | Utilities | |
| Industry | Utilities - Regulated Electric | |
| Market Cap ⓘ | $50.16B | |
| Beta ⓘ | 0.45 | |
Value (Cheapness) | ||
| P/E Ratio ⓘ | 26.85 | 17.28 |
| P/B Ratio ⓘ | 2.64 | 1.51 |
| FCF Yield ⓘ | -6.28% | 0.65% |
| Dividend Yield ⓘ | 2.42% | 3.77% |
| EBIT / EV ⓘ | 4.30% | 5.01% |
| PEG ⓘ | 1.52 | |
Growth (Business expansion) | ||
| Revenue Growth ⓘ | 5.90% | 6.10% |
| RPS Growth (5Y CAGR) ⓘ | -0.28% | 3.87% |
| EPS Growth (5Y CAGR) ⓘ | -18.88% | -11.30% |
| BVPS Growth (5Y CAGR) ⓘ | 6.78% | 4.23% |
| Margin Growth (5Y Trend) ⓘ | 9.60% | 3.57% |
| FCF Growth (5Y CAGR) ⓘ | -9.29% | -8.84% |
| DPS Growth (5Y CAGR) ⓘ | 5.42% | 4.84% |
Quality (Business durability) | ||
| ROIC (Latest) ⓘ | N/A | 6.53% |
| ROA (Latest) ⓘ | 2.44% | 3.20% |
| ROIC (5Y Median) ⓘ | 5.41% | 5.95% |
| ROA (5Y Median) ⓘ | 1.90% | 2.75% |
| Net Debt / EBIT (Latest) ⓘ | 10.27 | 7.13 |
| Net Debt / EBIT (5Y Median) ⓘ | 10.97 | 7.23 |
| Net Debt / EBITDA (Latest) ⓘ | 5.78 | 4.31 |
| Net Debt / Assets ⓘ | 43.68% | 38.42% |
| EBITDA / Interest ⓘ | 4.05 | 4.58 |
| Operating Margin (Latest) ⓘ | 24.93% | 20.83% |
| Operating Margin (5Y Median) ⓘ | 21.83% | 20.08% |
| Debt to Equity (Latest) ⓘ | 187.70% | 137.69% |
| Profit Margin (Latest) ⓘ | 13.33% | 11.37% |
| Free Cash Flow (Latest) ⓘ | -$3.15B | |
Momentum (Price trend) | ||
| 3Y Return ⓘ | +146.26% | +52.37% |
| 12M Return (excl. last month) ⓘ | +17.64% | +8.84% |
| 6M Return ⓘ | -8.54% | -3.95% |
| Price vs. 200-Day MA ⓘ | -1.29% | -0.79% |
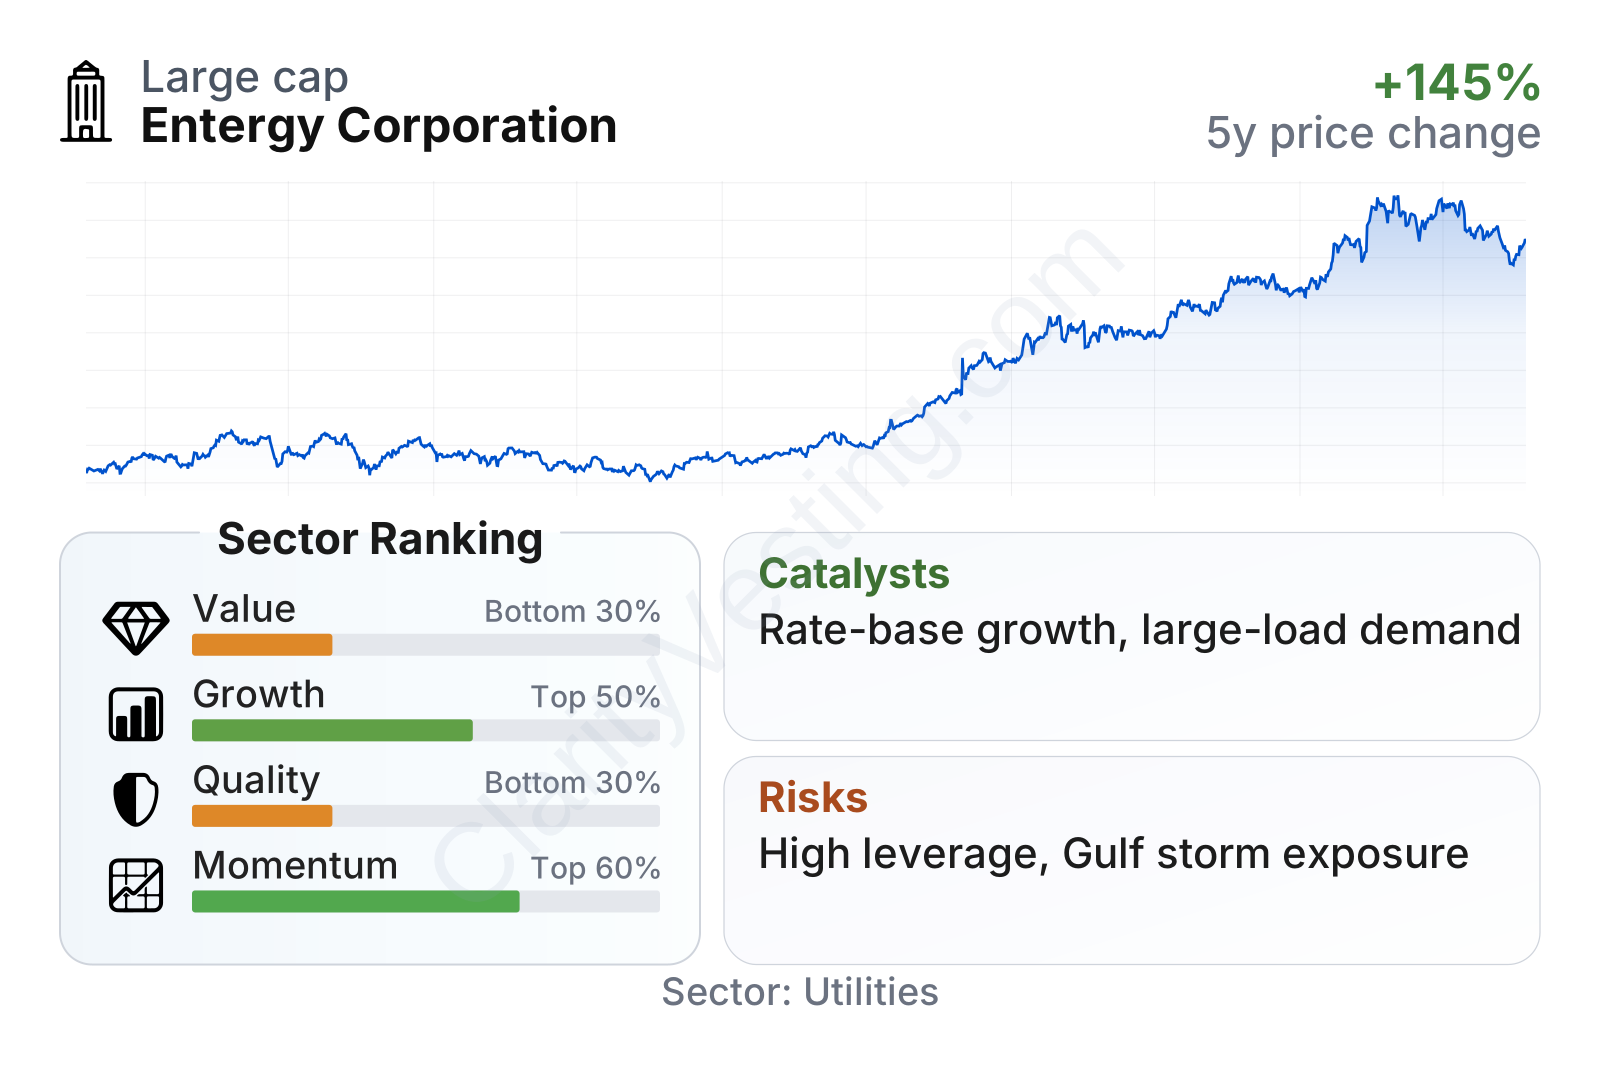
Entergy stands out as a large regulated utility with relatively low share-price volatility, reflected in a beta well below 1. Its recent stock performance has been strong over multi-year periods, but the factor breakdown is less flattering underneath: valuation sits in the weaker end of the utility sector, growth is around the middle, and balance-sheet quality is below many peers because leverage is high and free cash flow is deeply negative. Profitability, however, is better than the sector median, which helps explain why the market has rewarded the shares despite a richer valuation.
Growth
Entergy operates in a sector that is becoming more relevant, not less. Electric utilities are benefiting from long-duration demand drivers such as grid modernization, industrial reshoring, electrification, data center development, and the need for more resilient infrastructure in weather-exposed regions. In Entergy’s case, the Gulf South footprint adds another angle: the region has a meaningful industrial base and is seeing interest tied to manufacturing and large-load projects.
The company’s strategy is broadly consistent with how successful regulated utilities create long-term growth. Entergy is investing heavily in transmission, distribution, generation replacement, and storm hardening. Those investments matter because utility regulators generally allow a return on approved capital placed into service. In other words, if Entergy continues building assets that regulators support, its earnings base can rise over time even if electricity demand growth remains moderate.
Revenue per share has been uneven rather than consistently rising, which shows that Entergy is not a simple top-line growth story. Rate cases, customer usage, fuel cost pass-throughs, and accounting effects can all distort annual revenue. For a utility like this, the more important long-term question is whether the regulated asset base and authorized earnings can expand steadily. On that front, the company’s investment plan appears more important than short-term sales fluctuations.
Free cash flow has remained negative, but that is not unusual for a utility in a heavy buildout phase. The key distinction is whether negative cash flow comes from productive capital spending that can be recovered through future rates. For Entergy, that appears to be the central case. The trade-off is clear: near-term cash generation looks weak, while the company is trying to build a larger future earnings platform.
Recent company updates have highlighted continued capital investment, transmission development, and system-resilience projects. Another growth catalyst is large customer demand in the service territory, especially from industrial activity and very large new loads that require reliable power infrastructure. If those projects move from discussion to committed usage, Entergy could see stronger demand growth than many slower-growing utilities.
Risks
This article is for informational purposes only and does not constitute financial advice. Some content is AI-generated. See Disclaimer


