Stock Analysis · Eton Pharmaceuticals Inc (ETON)
Overview
Eton Pharmaceuticals is a small but fast-growing specialty pharmaceutical company focused on bringing treatments to market for rare diseases and other unmet medical needs. Rather than operating like a large traditional drug developer with a broad in-house research engine, Eton’s model is more selective: it acquires, develops, and commercializes products that often target niche areas where competition can be limited and pricing can be more favorable. Its portfolio includes hospital products, rare disease therapies, and specialty medicines marketed mainly in the United States.
The business has become increasingly centered on rare disease products, especially after the launch and expansion of newer assets. That matters because rare disease medicines can have longer commercial lifecycles, less direct competition, and more predictable demand once prescribers adopt them. At the same time, Eton still has meaningful exposure to legacy products and hospital-focused medicines that help diversify revenue.
Based on recent company disclosures, Eton’s revenue mix appears to be led by a handful of key products rather than a broad, evenly distributed portfolio. Exact percentages can shift quarter to quarter, but the current business mix appears to be approximately:
- ALKINDI SPRINKLE: roughly 40% to 50% of revenue. This is an oral hydrocortisone product used in pediatric adrenal insufficiency and is one of the company’s most important growth drivers.
- Rare disease products added more recently, including GALZIN and other specialty assets: roughly 20% to 30% combined. These products expand Eton’s presence in targeted, underserved markets.
- Hospital and injectable products, including Biorphen and related products: roughly 15% to 25%. These medicines have historically been relevant contributors, though growth here is less dramatic than in rare disease.
- Other specialty products and partnership-related revenue: the remaining share. This includes smaller commercial products and occasional revenue tied to agreements or distribution arrangements.
Eton’s financial profile shows a company that has moved from a low-revenue, loss-making phase into a much larger commercial operation. Revenue rose sharply from roughly $22 million in 2021 to about $80 million in 2025, while gross profit also expanded significantly. The more important change is that sales have been scaling faster than core operating costs, which has started to improve operating leverage even if bottom-line earnings have remained uneven because of interest expense and commercialization costs.
The long-term pattern is clear: revenue and gross profit have climbed meaningfully, while selling and administrative costs have also increased as the company built a larger commercial platform. The key improvement is that the business is no longer operating at the very small scale seen a few years ago, and it is now showing signs of stronger earnings power if newer products continue to gain traction.
Key Figures
| Metric | Value | Sector ⓘ |
|---|---|---|
| Date | Oct 17, 2026 | |
| Context | ||
| Sector | Healthcare | |
| Industry | Drug Manufacturers - Specialty & Generic | |
| Market Cap ⓘ | $1.51B | |
| Beta ⓘ | 0.90 | |
Value (Cheapness) | ||
| P/E Ratio ⓘ | 132.20 | 24.79 |
| P/B Ratio ⓘ | 36.13 | 3.08 |
| FCF Yield ⓘ | 0.97% | 3.15% |
| Dividend Yield ⓘ | N/A | 1.94% |
| EBIT / EV ⓘ | 0.97% | 0.57% |
| PEG ⓘ | N/A | |
Growth (Business expansion) | ||
| Revenue Growth ⓘ | 98.60% | 7.45% |
| RPS Growth (5Y CAGR) ⓘ | 36.09% | 8.61% |
| EPS Growth (5Y CAGR) ⓘ | N/A | -17.81% |
| BVPS Growth (5Y CAGR) ⓘ | 8.58% | 3.72% |
| Margin Growth (5Y Trend) ⓘ | N/A | -0.62% |
| FCF Growth (5Y CAGR) ⓘ | N/A | 1.04% |
| DPS Growth (5Y CAGR) ⓘ | N/A | 6.77% |
Quality (Business durability) | ||
| ROIC (Latest) ⓘ | 25.26% | 3.24% |
| ROA (Latest) ⓘ | 11.52% | 3.01% |
| ROIC (5Y Median) ⓘ | -3.75% | 4.60% |
| ROA (5Y Median) ⓘ | -7.09% | 1.89% |
| Net Debt / EBIT (Latest) ⓘ | 0.14 | 1.34 |
| Net Debt / EBIT (5Y Median) ⓘ | N/A | 1.84 |
| Net Debt / EBITDA (Latest) ⓘ | 0.11 | 1.00 |
| Net Debt / Assets ⓘ | 1.85% | 5.45% |
| EBITDA / Interest ⓘ | 4.60 | 9.64 |
| Operating Margin (Latest) ⓘ | 14.59% | 9.27% |
| Operating Margin (5Y Median) ⓘ | -4.62% | 7.38% |
| Debt to Equity (Latest) ⓘ | 62.22% | 28.58% |
| Profit Margin (Latest) ⓘ | 12.02% | 3.59% |
| Free Cash Flow (Latest) ⓘ | $14.73M | |
Momentum (Price trend) | ||
| 3Y Return ⓘ | +1209.44% | +42.80% |
| 12M Return (excl. last month) ⓘ | +208.94% | +18.50% |
| 6M Return ⓘ | +90.32% | +7.57% |
| Price vs. 200-Day MA ⓘ | +51.82% | +5.12% |
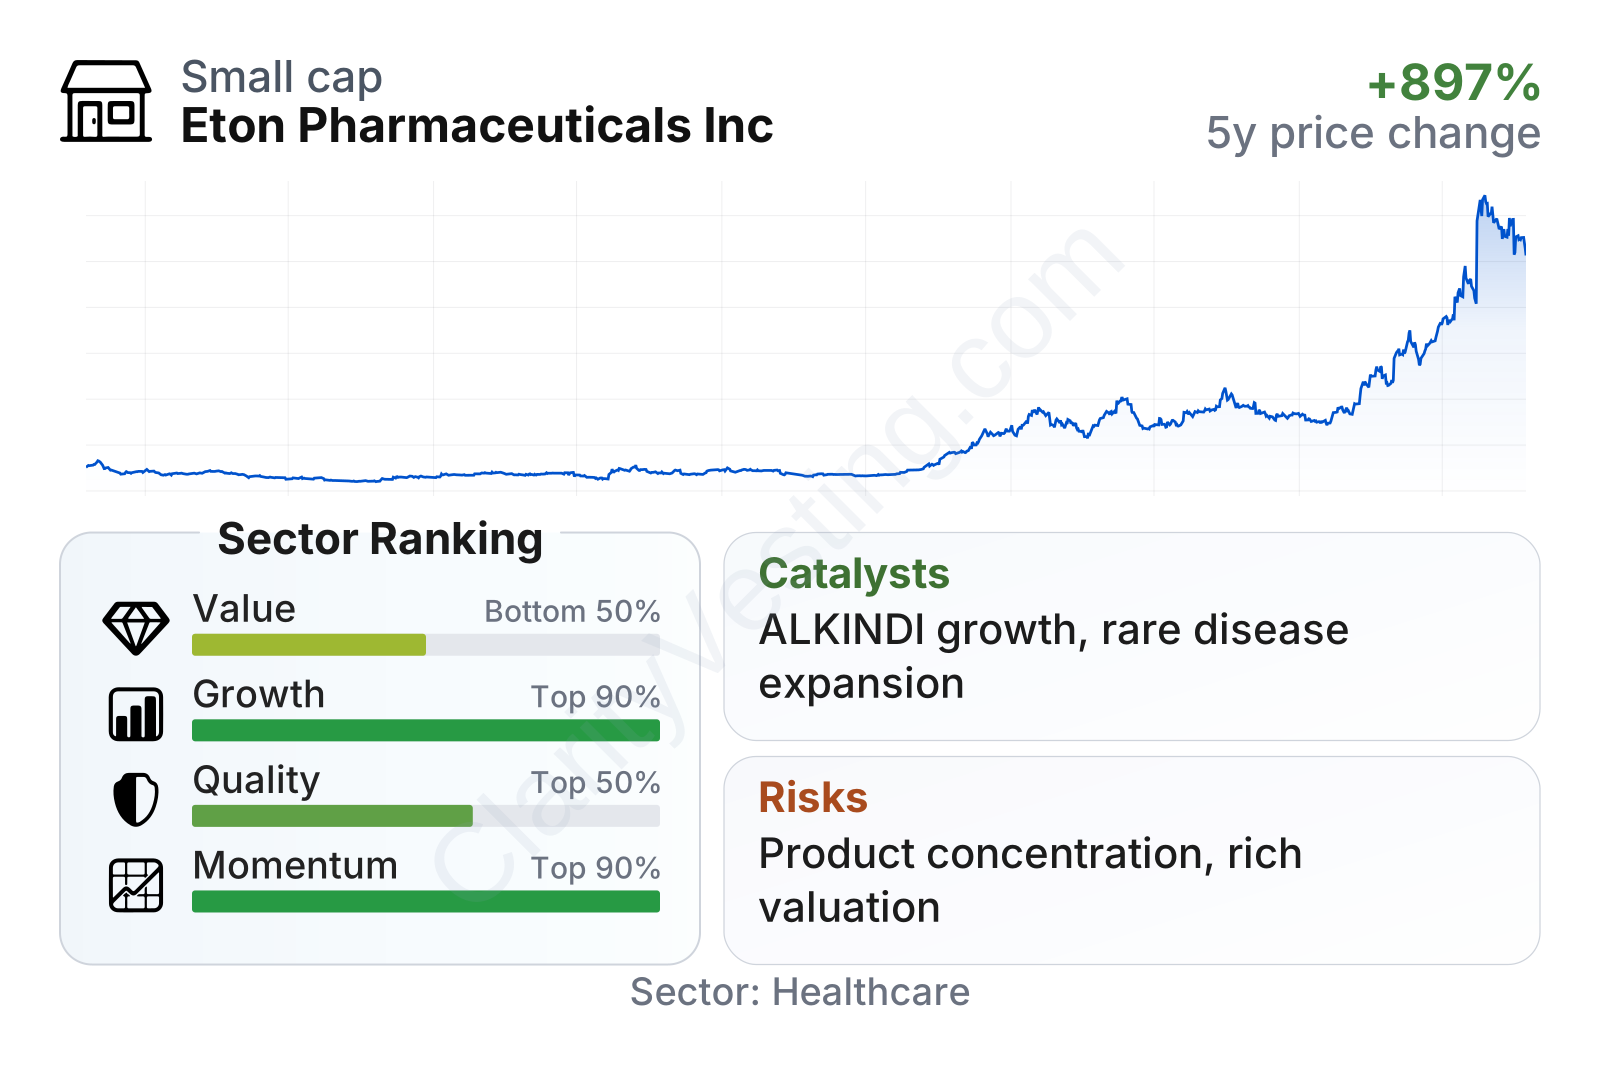
Eton now sits in an unusual position for a healthcare company of its size. Growth and share-price momentum rank near the top of the sector, while profitability metrics have improved enough to place quality around the middle to upper half of peers. At the same time, valuation metrics look stretched versus sector medians, with a very high earnings multiple and a price-to-book ratio far above typical healthcare names. In short, the market is giving a lot of credit for future expansion, not just current results.
The stock’s multiyear move has been dramatic. After trading near $2 to $5 through much of 2022 and 2023, the shares advanced sharply through 2025 and into 2026. That rise reflects a business that has crossed an important threshold: the market now views Eton less as an early-stage specialty pharma company and more as a commercial rare-disease platform with real scaling potential.
Growth
Eton operates in an attractive part of healthcare. Rare disease and specialty pharmaceuticals tend to benefit from durable demand, relatively focused physician networks, and a commercial model that can work well even for a small company. These markets are also less dependent on mass-market advertising and can reward companies that build expertise around narrow conditions with high unmet need.
Eton’s strategy is logical for future expansion. Instead of taking on the risk and cost structure of a large research-based biotech company, it has largely pursued assets that are already approved, near approval, or commercially launchable within a reasonable time frame. That approach lowers scientific risk compared with early-stage drug development, although execution risk remains important. For a company of Eton’s size, this is a practical way to build a portfolio and use commercial infrastructure across multiple products.
The pace of growth has been exceptional. Recent year-over-year revenue growth has frequently been far above the healthcare sector median, and the latest reading was close to 100%. That does not mean this rate is sustainable every quarter, but it does show that Eton is still in a scaling phase rather than a mature phase. Over a five-year view, revenue per share growth has also been several times stronger than the sector median, which supports the idea that the company’s expansion is not only acquisition-driven but also increasingly commercial in nature.
Cash generation has improved materially as well. Free cash flow moved from clearly negative territory in 2022 to positive levels in 2024, 2025, and 2026, reaching the mid-teens of millions on a trailing basis most recently. That is an important milestone because it suggests the company is no longer relying purely on external financing to support operations and product launches. For a smaller pharmaceutical company, that shift can significantly improve strategic flexibility.
One of the strongest catalysts is the company’s growing rare disease franchise. ALKINDI SPRINKLE has become a major product, and management has continued to add assets that fit the same commercialization model. Recent company updates have highlighted portfolio expansion, product launches, and distribution progress that could further increase revenue concentration in higher-value specialty medicines. If these products continue to gain prescription adoption, Eton’s commercial base could become both larger and more resilient.
Another notable opportunity is that Eton has already built a commercial platform that can absorb additional products. For a company with a focused sales and market access structure, each new product does not require building an entirely new organization from scratch. That creates the possibility of stronger margins over time if revenue keeps growing faster than operating expenses.
Risks
This article is for informational purposes only and does not constitute financial advice. Some content is AI-generated. See Disclaimer


