Stock Analysis · Energy Transfer LP (ET)
Overview
Energy Transfer LP is one of the largest midstream energy companies in the United States. In simple terms, it owns and operates the infrastructure that moves, stores, fractionates, and exports energy products. That includes natural gas pipelines, crude oil pipelines, natural gas liquids systems, storage terminals, processing plants, and export facilities. Unlike an oil producer, Energy Transfer does not mainly depend on discovering or drilling for hydrocarbons. Its role is closer to a toll-road operator for energy volumes moving through its network.
The business is spread across nearly every major part of the U.S. energy chain, with assets connected to major producing regions such as the Permian Basin, Marcellus, Haynesville, Eagle Ford, Bakken, and the Gulf Coast. This broad footprint matters because it lowers dependence on any one field, customer, or product type and gives the company multiple ways to benefit from high production and export demand.
Based on segment reporting in recent company filings, Energy Transfer’s revenue mix is led by businesses tied to liquids transportation and gathering, followed by natural gas transportation and storage, then midstream services and terminals. Exact percentages can move meaningfully with commodity prices and marketing activity, but the ranking is generally as follows:
- Crude oil transportation and services: typically the largest reported revenue source. This includes crude pipelines, terminals, storage, and related services.
- NGL and refined products: a major contributor. This includes natural gas liquids transportation, fractionation, storage, and refined products logistics.
- Midstream: gathering, processing, compression, and treating services, largely tied to natural gas and NGL production areas.
- Interstate natural gas transportation and storage: long-haul natural gas pipelines and storage assets operating under contracted or regulated structures.
- Intrastate natural gas transportation and storage: in-state gas pipelines and storage, especially in Texas.
- Terminals: fuel distribution terminals, storage, and marine-related logistics.
A useful way to think about the company is that cash generation is usually more stable than revenue. Reported sales can swing sharply because certain businesses include pass-through commodity values and marketing activity, while the underlying fee-based earnings base tends to be steadier. Over the last several years, total revenue moved up and down, but gross profit and operating income held up much better, showing the importance of the infrastructure model rather than headline sales alone.
The long-term pattern shows a business with very large revenue, a high cost base typical of commodity-linked logistics, and a steadier layer of operating profit underneath. Gross profit has improved over time even when total revenue did not rise in a straight line, which suggests that asset utilization and fee-generating operations matter more than top-line volatility.
Key Figures
| Metric | Value | Sector ⓘ |
|---|---|---|
| Date | Oct 24, 2026 | |
| Context | ||
| Sector | Energy | |
| Industry | Oil & Gas Midstream | |
| Market Cap ⓘ | $67.32B | |
| Beta ⓘ | 0.60 | |
Value (Cheapness) | ||
| P/E Ratio ⓘ | 13.39 | 15.40 |
| P/B Ratio ⓘ | 3.51 | 1.71 |
| FCF Yield ⓘ | 7.75% | 8.24% |
| Dividend Yield ⓘ | 6.69% | 3.52% |
| EBIT / EV ⓘ | 7.46% | 7.45% |
| PEG ⓘ | 0.62 | |
Growth (Business expansion) | ||
| Revenue Growth ⓘ | 78.40% | 26.85% |
| RPS Growth (5Y CAGR) ⓘ | -2.07% | 6.78% |
| EPS Growth (5Y CAGR) ⓘ | -12.49% | -14.41% |
| BVPS Growth (5Y CAGR) ⓘ | -10.97% | 6.08% |
| Margin Growth (5Y Trend) ⓘ | -1.44% | 0.55% |
| FCF Growth (5Y CAGR) ⓘ | -17.59% | 2.75% |
| DPS Growth (5Y CAGR) ⓘ | 16.92% | 16.79% |
Quality (Business durability) | ||
| ROIC (Latest) ⓘ | 9.65% | 11.30% |
| ROA (Latest) ⓘ | 4.19% | 6.00% |
| ROIC (5Y Median) ⓘ | 9.68% | 10.35% |
| ROA (5Y Median) ⓘ | 4.03% | 5.46% |
| Net Debt / EBIT (Latest) ⓘ | 6.65 | 1.64 |
| Net Debt / EBIT (5Y Median) ⓘ | 6.01 | 1.82 |
| Net Debt / EBITDA (Latest) ⓘ | 4.20 | 1.08 |
| Net Debt / Assets ⓘ | 46.72% | 17.29% |
| EBITDA / Interest ⓘ | 4.67 | 9.53 |
| Operating Margin (Latest) ⓘ | 9.96% | 16.21% |
| Operating Margin (5Y Median) ⓘ | 11.63% | 20.55% |
| Debt to Equity (Latest) ⓘ | 198.80% | 52.27% |
| Profit Margin (Latest) ⓘ | 4.92% | 8.79% |
| Free Cash Flow (Latest) ⓘ | $5.22B | |
Momentum (Price trend) | ||
| 3Y Return ⓘ | +81.02% | +68.93% |
| 12M Return (excl. last month) ⓘ | +29.86% | +42.90% |
| 6M Return ⓘ | +9.81% | +9.18% |
| Price vs. 200-Day MA ⓘ | +5.12% | +9.87% |
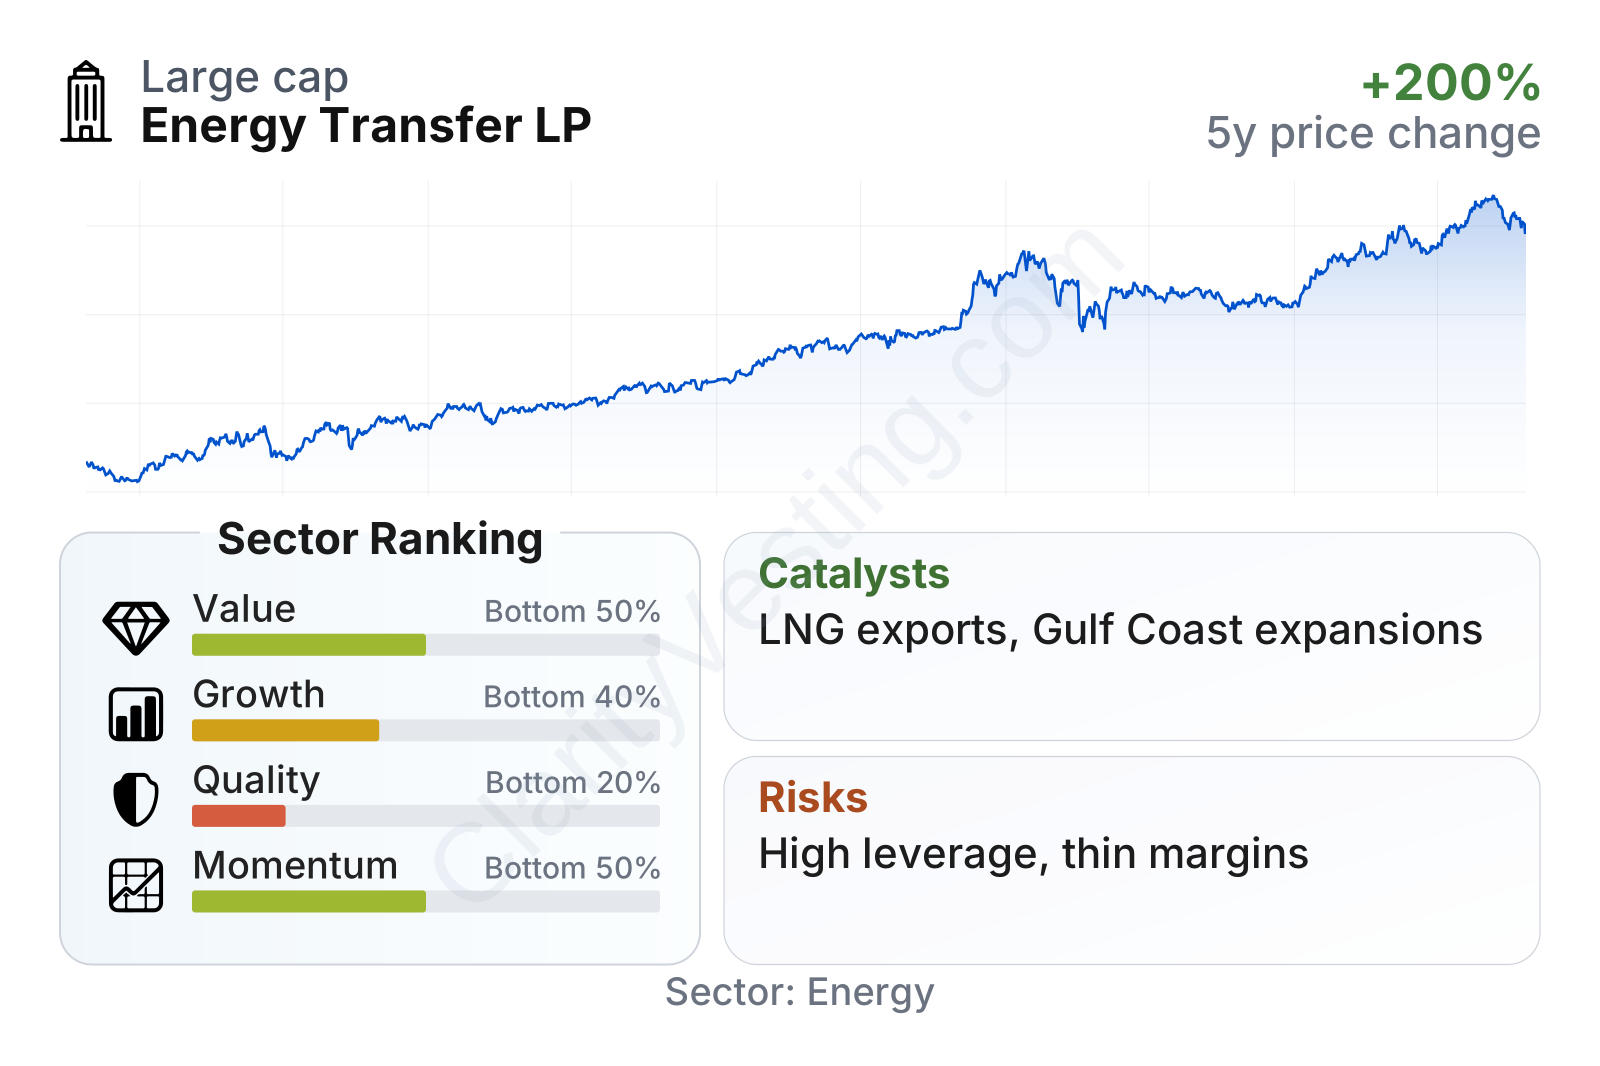
Energy Transfer is a very large midstream operator with a lower-than-market beta, which fits the steadier nature of pipeline and storage assets. On valuation, the picture is mixed: earnings multiples are around the sector range, the cash distribution yield is clearly above the sector median, but free cash flow yield is not especially cheap relative to peers. Quality metrics are the weak spot, mainly because leverage is high and profitability ratios sit below many energy companies. Growth indicators also need careful reading: short-term revenue growth is strong, but longer-term per-share growth and free cash flow trends are less impressive.
The stock price performance over the past several years has been strong, rising from depressed levels in 2021 to much higher levels by mid-2026. That recovery reflects higher confidence in cash generation, balance sheet progress compared with earlier years, and the market’s renewed willingness to value large energy infrastructure assets more favorably.
Growth
Energy Transfer operates in a sector that still has a credible long-term role, even though it is not a classic high-growth industry. Midstream infrastructure benefits when U.S. oil, natural gas, and natural gas liquids production remains high and when export demand grows. That is especially relevant for Energy Transfer because its network is heavily connected to the Gulf Coast, where U.S. LNG exports, NGL exports, and crude exports continue to shape industry investment.
The company’s strategy is logical for this environment. It already owns a wide network, so growth does not need to come only from building entirely new systems. It can also come from expansions, optimization, additional processing and fractionation capacity, higher export volumes, and connecting new production and demand points into existing assets. This is an attractive feature in midstream because expanding around an installed network is often cheaper and less risky than starting from scratch.
Recent revenue growth has turned sharply positive again after a weaker period, but that should not be read as pure structural growth. For Energy Transfer, revenue can move with commodity-related activity and marketing volumes. The more important question is whether volume throughput, utilization, and fee-based earnings continue to rise. The company’s broad exposure to natural gas, NGLs, crude, and export markets supports that possibility better than a narrowly focused operator would.
Free cash flow remains substantial in absolute dollars, even though it has come down from earlier highs. For a capital-intensive business, that matters because it shows the company still has room to fund distributions, capital spending, and debt management from internally generated cash. The key challenge is that free cash flow has not moved in a straight upward line, which means growth is real but not frictionless.
One of the clearest catalysts is the continued rise of U.S. natural gas and NGL demand tied to exports. LNG facilities, petrochemical demand, and international appetite for U.S. energy all support more pipeline and terminal usage over time. Energy Transfer’s scale in Texas and along the Gulf Coast gives it a practical advantage in capturing that demand. Another catalyst is project expansion around existing assets, which can improve returns without requiring the same level of greenfield risk.
Recent company updates have also emphasized expansion projects, optimization investments, and continued demand for transportation, storage, and export-related services. For a company already operating at scale, these incremental projects can be meaningful because each added connection can feed multiple parts of the network.
Risks
This article is for informational purposes only and does not constitute financial advice. Some content is AI-generated. See Disclaimer


