Stock Analysis · Elbit Systems Ltd (ESLT)
Overview
Elbit Systems Ltd is an Israeli aerospace and defense company that develops and manufactures a wide range of military systems. Its products are used on aircraft, helicopters, land vehicles, naval platforms, border systems, and by soldiers in the field. The company is especially active in areas such as unmanned aircraft, precision munitions, military electronics, electro-optics, communications, intelligence systems, electronic warfare, artillery, and training solutions.
Its business model is mainly project-based: governments and defense agencies place orders for equipment, upgrades, maintenance, and long-term support. Because of that, revenue is tied less to consumer demand and more to defense budgets, procurement cycles, and geopolitical priorities.
Based on the company’s reporting structure, Elbit’s main revenue sources are organized by operating segment. The mix can move from year to year, but recent filings show the business is broadly diversified across several defense categories.
- Aerospace: about 35% of revenue. This includes military aircraft systems, helicopters, unmanned aerial systems, precision-guided munitions, intelligence and surveillance payloads, and related support.
- C4I and Cyber: about 22% of revenue. This covers command, control, communications, computers, intelligence solutions, radios, networked battlefield systems, and cyber-related capabilities.
- Land: about 20% of revenue. This includes artillery, armored vehicle systems, munitions, land-based sensors, protection systems, and vehicle modernization.
- ISTAR and EW: about 18% of revenue. This segment includes intelligence, surveillance, target acquisition and reconnaissance, electro-optics, night vision, electronic warfare, and signal-related systems.
- Elbit Systems of America: about 16% of revenue. This is the group’s U.S.-focused business serving American defense programs across several technologies.
These segment percentages overlap because the company also reports a U.S. subsidiary segment alongside technology-based segments, so they should be read as directional rather than additive. The broader point is that Elbit is not dependent on one single platform: it participates across air, land, digital battlefield, sensing, and support activities.
Geographically, revenue is spread across Israel, Europe, North America, Asia-Pacific, and other international markets, with Europe and Israel becoming increasingly important as defense spending has risen.
The business has expanded meaningfully over the past several years, with revenue climbing from a little above $5 billion in 2021 to nearly $8 billion in 2025. Profitability also improved in 2025 after a weaker 2023 period, helped by stronger operating income and better net earnings conversion.
Key Figures
| Metric | Value | Sector ⓘ |
|---|---|---|
| Date | Oct 03, 2026 | |
| Context | ||
| Sector | Industrials | |
| Industry | Aerospace & Defense | |
| Market Cap ⓘ | $32.96B | |
| Beta ⓘ | -0.30 | |
Value (Cheapness) | ||
| P/E Ratio ⓘ | 52.92 | 22.45 |
| P/B Ratio ⓘ | 7.44 | 1.98 |
| FCF Yield ⓘ | 2.10% | 6.31% |
| Dividend Yield ⓘ | 0.57% | 1.96% |
| EBIT / EV ⓘ | 2.12% | 4.81% |
| PEG ⓘ | 8.79 | |
Growth (Business expansion) | ||
| Revenue Growth ⓘ | 15.90% | 9.10% |
| RPS Growth (5Y CAGR) ⓘ | 9.15% | 7.75% |
| EPS Growth (5Y CAGR) ⓘ | 7.29% | -13.59% |
| BVPS Growth (5Y CAGR) ⓘ | 11.39% | 6.22% |
| Margin Growth (5Y Trend) ⓘ | 0.26% | 0.72% |
| FCF Growth (5Y CAGR) ⓘ | 27.24% | 10.98% |
| DPS Growth (5Y CAGR) ⓘ | 9.57% | 9.48% |
Quality (Business durability) | ||
| ROIC (Latest) ⓘ | 14.37% | 10.92% |
| ROA (Latest) ⓘ | 4.87% | 5.41% |
| ROIC (5Y Median) ⓘ | 8.58% | 9.21% |
| ROA (5Y Median) ⓘ | 3.10% | 4.94% |
| Net Debt / EBIT (Latest) ⓘ | 0.80 | 2.07 |
| Net Debt / EBIT (5Y Median) ⓘ | 2.93 | 2.28 |
| Net Debt / EBITDA (Latest) ⓘ | 0.64 | 1.43 |
| Net Debt / Assets ⓘ | 4.31% | 19.27% |
| EBITDA / Interest ⓘ | 7.49 | 9.53 |
| Operating Margin (Latest) ⓘ | 8.75% | 10.50% |
| Operating Margin (5Y Median) ⓘ | 6.95% | 10.27% |
| Debt to Equity (Latest) ⓘ | 19.33% | 65.48% |
| Profit Margin (Latest) ⓘ | 7.44% | 6.62% |
| Free Cash Flow (Latest) ⓘ | $692.77M | |
Momentum (Price trend) | ||
| 3Y Return ⓘ | +253.02% | +58.56% |
| 12M Return (excl. last month) ⓘ | +46.64% | +15.63% |
| 6M Return ⓘ | -19.49% | +4.19% |
| Price vs. 200-Day MA ⓘ | -11.53% | +0.93% |
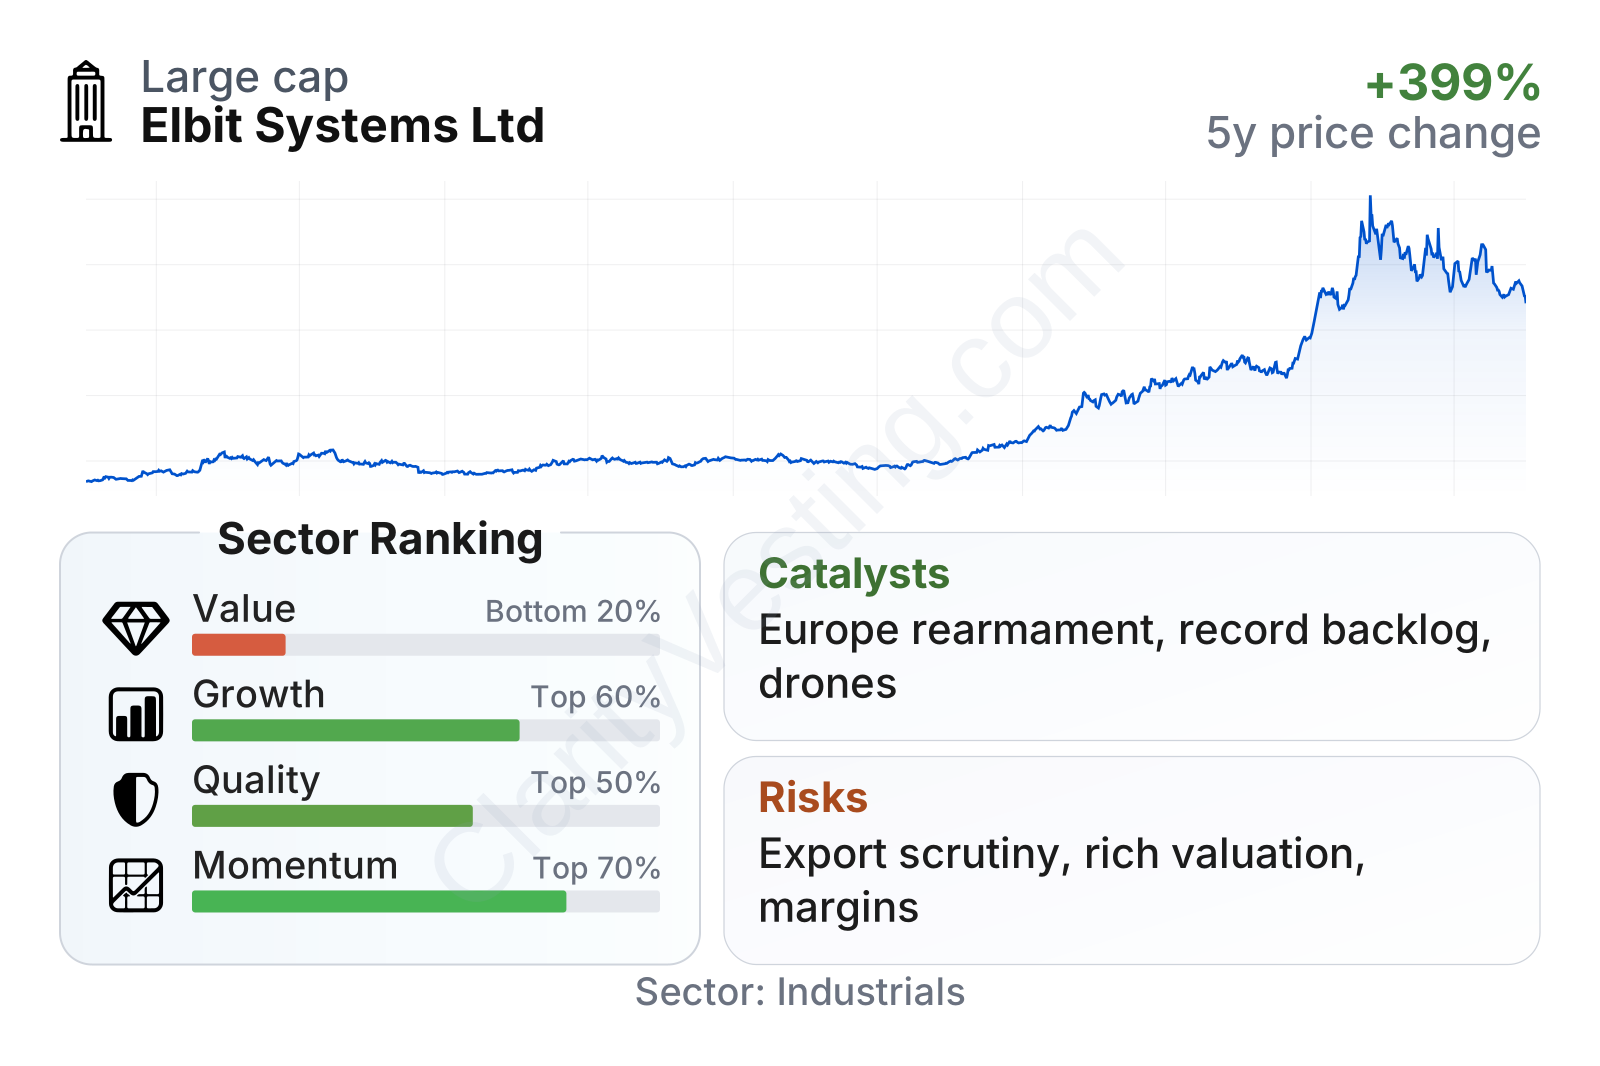
Elbit stands out more for growth and balance-sheet improvement than for cheapness. Growth, quality, and price momentum rank in the better half of the sector, while the valuation profile sits near the lower end because the stock trades at much higher earnings and book multiples than the industry median. The company is now a large defense contractor by market value, and its share price performance over three years has been exceptionally strong, although the last six months have been more volatile.
The current financial profile shows a mixed but generally solid picture. Revenue growth is running above the sector median, returns on invested capital are healthy, and leverage is low for this industry. At the same time, free cash flow yield and dividend yield are modest, which means much of the market’s enthusiasm is already reflected in the stock price rather than in immediate cash returns to shareholders.
Growth
Elbit operates in a sector with strong long-term support. Defense spending has been rising across Europe, the Middle East, and other regions as governments respond to military conflicts, ammunition shortages, border security concerns, and the need to modernize older equipment. Demand is especially strong in areas where Elbit is active: drones, battlefield communications, artillery, intelligence systems, electronic warfare, precision strike, and vehicle upgrades.
The company’s strategy also fits these trends well. It is not trying to compete only in large headline platforms such as fighter jets or warships, where the biggest U.S. contractors dominate. Instead, it focuses on mission systems and integrated electronics that can be fitted onto existing platforms or sold as part of modernization programs. That usually creates a broader addressable market because militaries often upgrade current fleets rather than replace everything from scratch.
Recent growth has been stronger than the aerospace and defense sector median. After a softer phase in 2022, annual revenue growth accelerated and has recently stayed in the mid-teens range. That matters because it suggests Elbit is not only benefiting from a general defense upcycle, but also converting demand into delivered sales.
A major support for future revenue is backlog. In its recent annual reporting and investor communications, Elbit has continued to describe a record order backlog, giving it multi-year visibility. That is important in defense because backlog often signals whether current demand can sustain production, hiring, and capital deployment over several years rather than only a few quarters.
Cash generation has also improved materially. Free cash flow was negative during part of 2023 and 2024, then turned strongly positive in 2025 and remained positive into 2026. For a contractor handling large, long-cycle programs, this shift is meaningful because it suggests better working-capital execution and a healthier conversion of accounting profit into cash.
Another growth catalyst is Europe. Several European countries have been increasing procurement of artillery, ammunition, air-defense-related systems, reconnaissance capabilities, and electronic battlefield solutions. Elbit has already established positions in a number of European programs and local partnerships, which can help it participate in rearmament spending without needing to build every market presence from zero.
Recent company announcements have also highlighted new contract wins and program expansions across land systems, airborne systems, and defense electronics. Individual contracts can be uneven in timing, but together they reinforce the same pattern: Elbit is participating in areas where defense budgets are currently expanding fastest.
Risks
This article is for informational purposes only and does not constitute financial advice. Some content is AI-generated. See Disclaimer


